API Platform Engineering
Quality That Compounds
A Guide to SDLC Automation in the AI & Agentic Era — Ankit Sobti, CTO & Co-Founder
Problem statement
The QE function's mandate has expanded dramatically over the past five years. What was once a release gate is now expected to deliver three outcomes simultaneously: faster releases, fewer escaped defects, and continuous audit readiness. The team is being asked to compress release cycles, reduce production incidents, pass audits without engineering scrambles — and increasingly to make all of this work in an environment where AI is accelerating both how code gets written and how it gets consumed. The current operating model — frameworks per protocol, gates per stage, evidence assembled by hand at quarter-end — wasn't designed for that mandate.
For organizations with established QE programs —
the function exists, has people, has tools — but the operating model is structurally serial. Tests run after development. Audits run after the quarter. Evidence assembles after the incident. The Y-shape between engineering and quality joins at release time, and velocity gets capped by the slower branch. The question these organizations face is: how do we re-shape the function so quality runs in parallel with development, not afterward, without compromising the rigor we already have?
For organizations building or formalizing the QE function for the first time —
often triggered by a quality incident, a new regulatory regime, or AI-driven pace acceleration — the challenge is different. The pieces exist team-by-team but aren't coherent. There's no central catalog of tests, no unified gates, no shared evidence trail, no way to know which services are well-tested and which are exposed. The question these organizations face is: how do we build a coherent function without the program becoming a velocity tax that engineering teams route around?
These challenges compound into six specific problems
Quality is structurally serial. The classic operating model puts development on one branch and quality on another, joining at release. Tests run after code is written; integration tests after services are assembled; performance and security tests in pre-release windows; audits at quarter-end. The pipeline can't compress past the slower branch. As development accelerates — through smaller services, faster commits, AI-assisted code — the gap widens. The QE function ends up as the brake the rest of engineering is trying to bypass.
Testing waterfall ensures that all testing activities get compressed into a final all-or-nothing push. Teams get to announce they're dev complete and then testing begins — and that's where things can fall apart. Confidence doesn't accumulate over time. Risk does.
Testing tooling fragments along protocol and stage lines. A modern enterprise runs REST, GraphQL, gRPC, WebSocket, and event-driven services in production. Each gets a different tool: Pact for contract testing, k6 or JMeter for performance, Karate or ReadyAPI for end-to-end, custom harnesses for eventing. Each tool produces its own report, its own coverage view, its own evidence format. There is no unified picture of what is tested and what isn't, no portable test artifact across surfaces, and no way to enforce a consistent quality bar without coordinating across multiple vendors. Tooling spend grows linearly with the production surface area, and the seams between tools are where coverage actually leaks.
We have our own automation framework that we built in house with the combination of Jenkins, JMeter, Selenium and a couple other tools. One of the things I'm lacking currently is API performance testing or load testing. There's no defined framework for it.
Tests rot faster than they're maintained. Flaky tests get muted to keep the build green. Drift accumulates between spec and behavior. Brittle scripts break on cosmetic changes while silent regressions slip through. Maintenance cost scales with test count — meaning every team eventually hits a ceiling on how many tests they can sustain, and the ceiling is usually well below what actual coverage requires. The function ends up under-tested where it matters most: at integration boundaries, in long-tail services, and across the journey-level workflows that customers actually exercise.
We have been feature and delivery driven. And the first thing that stops is testing. I had one team who launched a product last year and they had 160 major incidents in production impacting our students. They have spent the last six months trying to recover from that — and they 'tested.' I have no automation suite. I have no regression suite.
Audit evidence is a scramble, not a system. When the audit window opens, engineering capacity gets pulled away from product work to assemble proof — manual collation of test runs, change tickets, deployment logs, and approval trails, often spanning multiple tools and sometimes multiple quarters. The shift toward continuous compliance regimes — SEC cyber materiality disclosure, DORA in financial services, FedRAMP continuous monitoring, PCI 4.0 — is making the periodic-scramble model unsustainable. Evidence has to be a continuous output of the pipeline, not an artifact assembled retroactively.
We are spending a lot of time having to say, okay, we're ready to do testing. Now I have to generate the environment file, generate a test plan, generate a test execution, manually trigger the execution, manually add the attachments, manually mark it as done, manually route it for approval. We're trying to trim that down.
Coverage concentrates in flagship services; the long tail is exposed. The services that got QE attention — the high-revenue APIs, the regulated workloads, the customer-facing checkout flows — are well-covered. Everything else underperforms. Defects cluster in the underinvested surface, where the absence of tests, mocks, monitors, and evidence is most acute. And these services are often least visible to engineering leadership, surfacing only when an incident lands. The flagship coverage masks the broader exposure until something breaks.
AI amplifies every gap in the pipeline. Two converging forces are now real, not aspirational. Build-time AI is increasing the rate at which code reaches the pipeline — coding agents and AI-assisted development are pushing more PRs through gates that were sized for human-paced review. Runtime AI is increasing the rate at which APIs get exercised in unexpected ways — agents pick endpoints by name, infer parameters, and fail creatively rather than consistently. Without rich context — specs, examples, mocks, known-good workflows, traceable failure modes — AI test generation produces plausible-looking tests that miss real failures, and AI-assisted development creates more change than the existing pipeline can validate. The flywheel applies in both directions: a strong pipeline gets amplified by AI; a thin pipeline produces more bugs, faster.
Why now
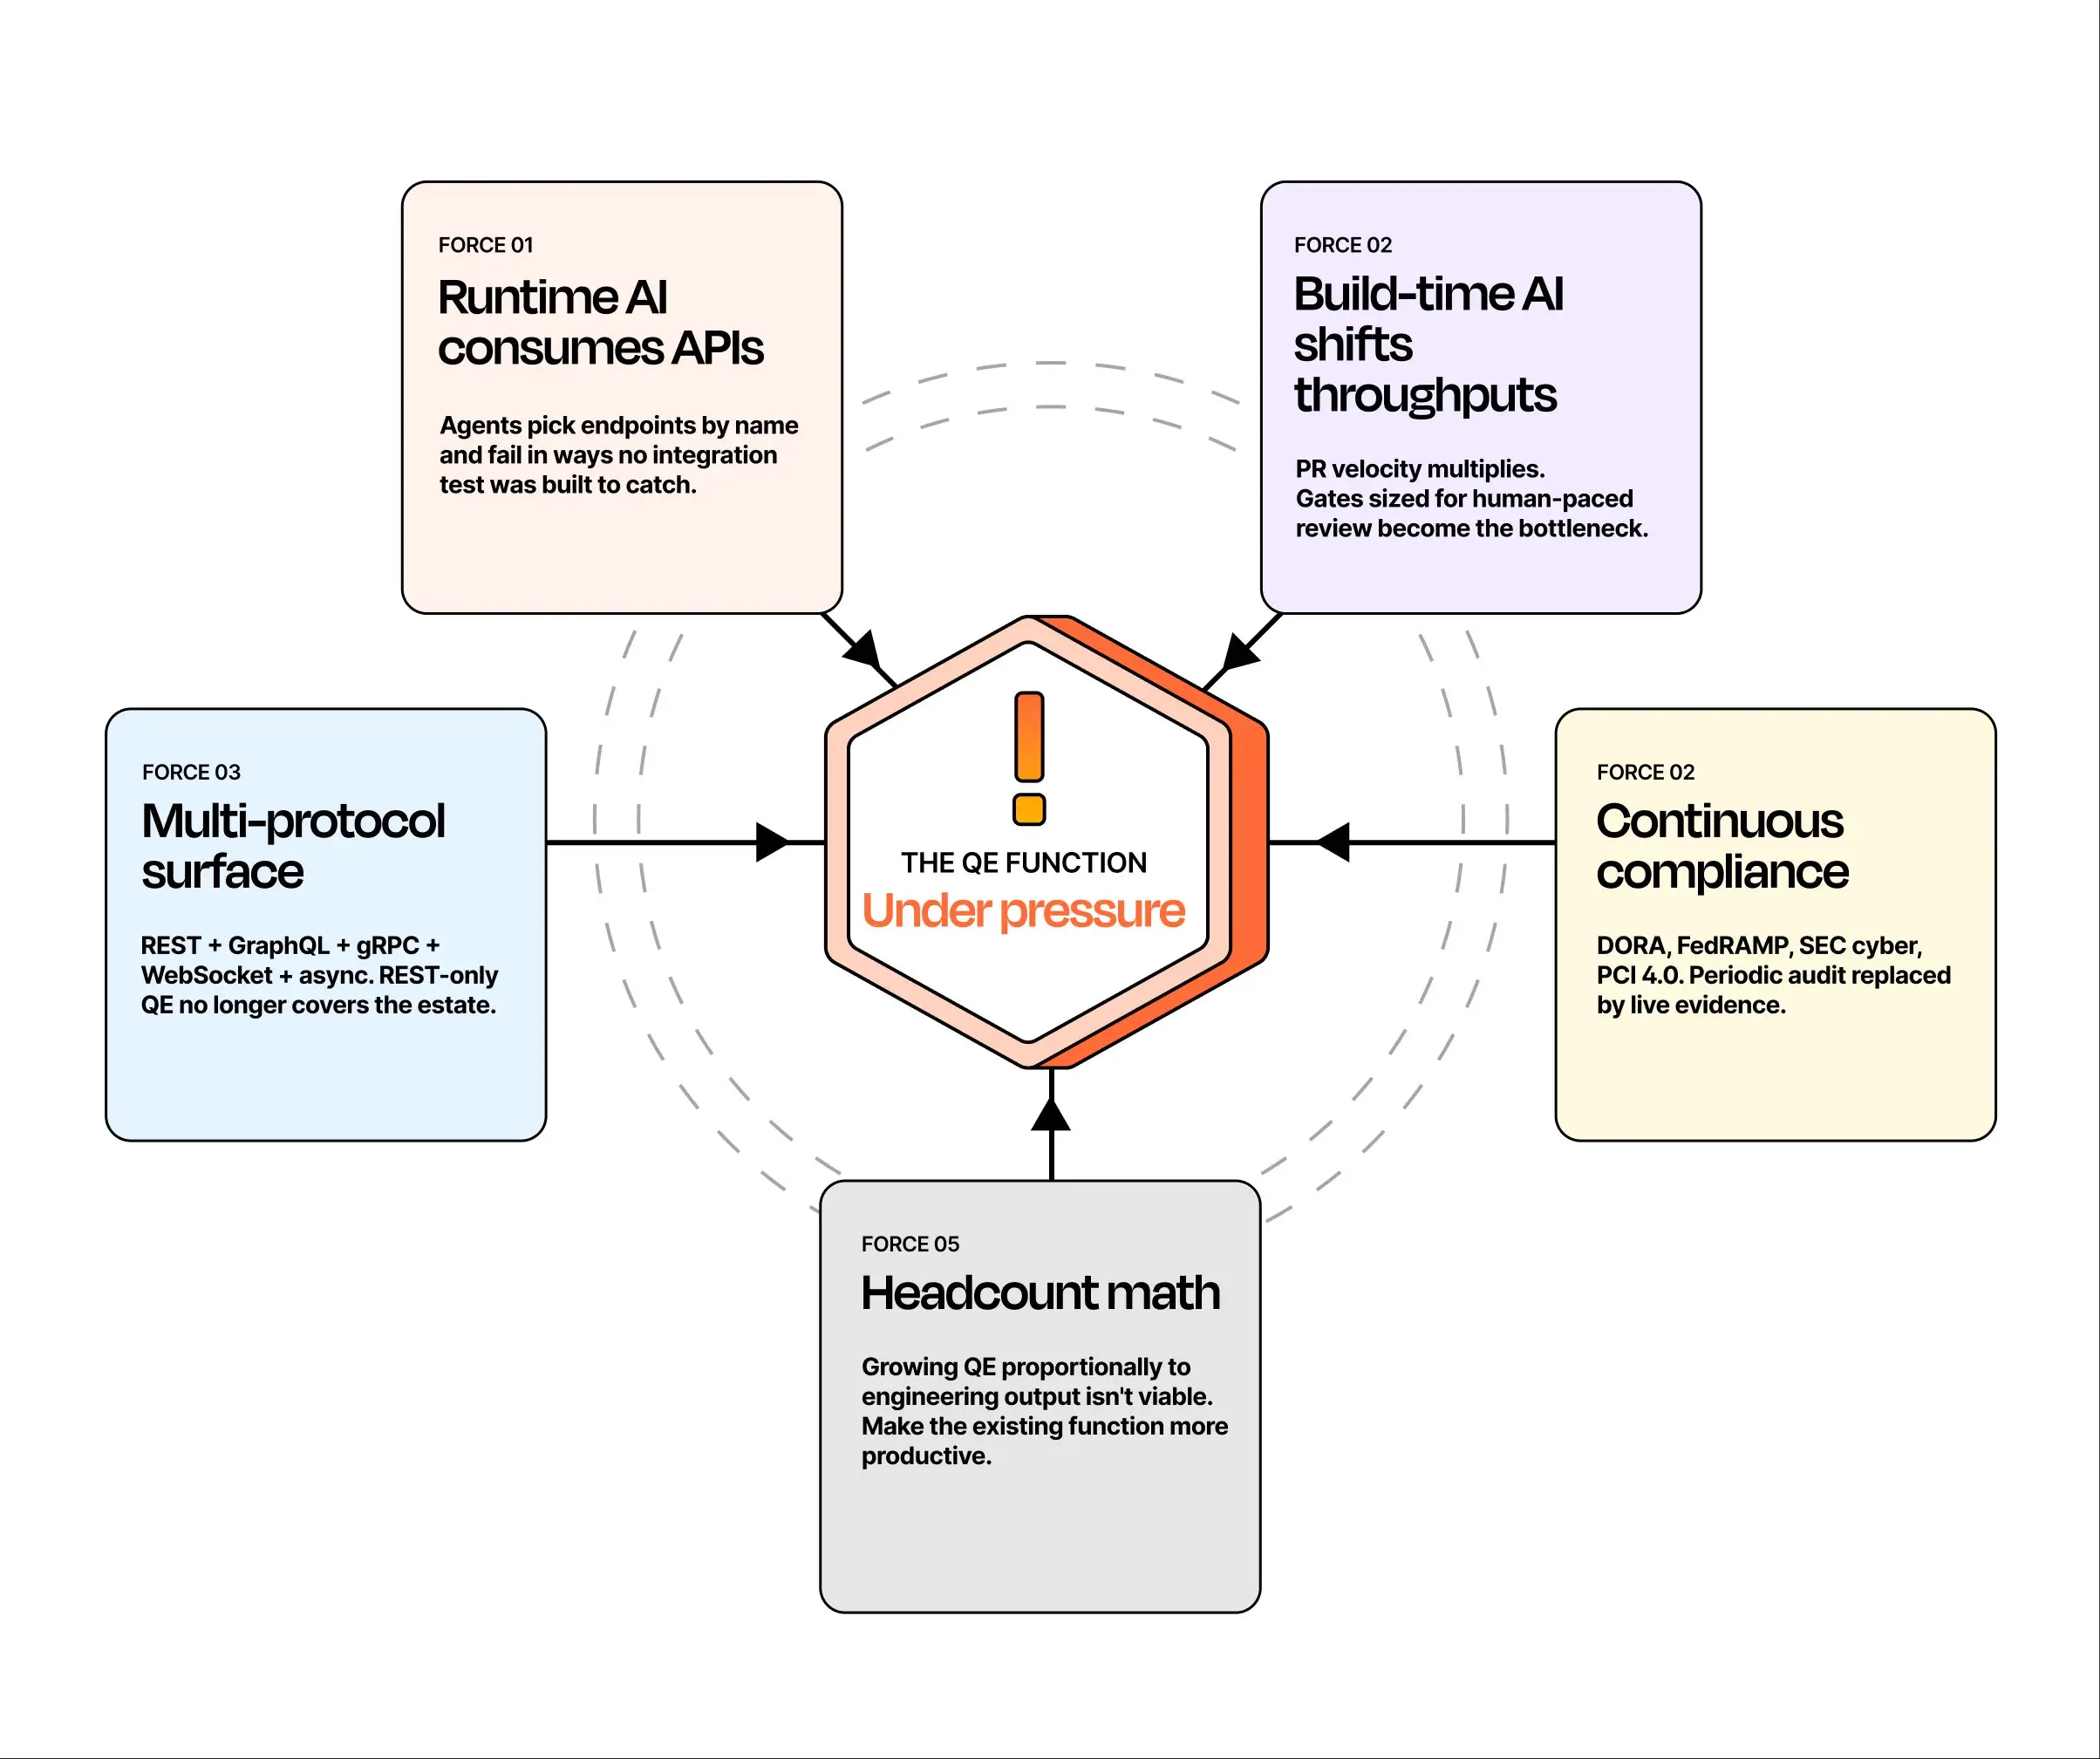
Five forces are converging from different directions, each one independently capable of breaking a QE program designed for the previous decade.
Every API in the estate now has a potential agentic consumer that may pick it by name without reading the docs, infer parameters from a tool description, and fail in ways no integration test was designed to catch. Test programs built for deterministic human-built consumers leave a coverage gap that AI consumers will find — at machine speed, in production.
Cursor, Claude Code, Copilot, and Codex are increasing PR velocity per developer by multiples in many engineering organizations. Gate infrastructure sized for human-paced throughput becomes the new bottleneck. Tests that take hours to run, suites that flake at 5%, manual review queues — none of these scale to the new pace. The QE function either becomes the throughput limiter or becomes the team that solves the throughput problem.
REST-only QE no longer covers the production estate. gRPC for service-to-service, GraphQL for client-facing, WebSocket and async eventing for real-time — each protocol adds a testing dimension. Programs that haven't unified across protocols are testing a fraction of their surface and don't know which fraction.
SEC cyber materiality disclosure, DORA, FedRAMP continuous monitoring, PCI 4.0, FDA SaMD, sector-specific AI governance regimes — all push toward continuous evidence. The QE function is increasingly the team that owns this evidence, and the manual scramble model can't keep up with regulators who expect the trail to be live, not assembled after the fact.
In a cost-constrained environment, growing QE headcount proportionally to engineering output isn't viable. The only path is to make the existing function dramatically more productive through automation, AI, and tooling consolidation — not by hiring more testers. Programs that can't make this shift fall further behind every quarter.
It was going to take two sprints to do it. Two sprint teams. Effectively, one guy did it in a couple hours using Claude. 140 apps refactored in a day.
The window for staying ahead of this is narrowing from all five directions at once.
Cost of inaction: Every slow release is unrealized revenue. Every escaped defect is a customer-facing incident with reputational tail. Every quarter-end audit scramble is engineering capacity not building product. And the curve is exponential — AI amplifies whatever pipeline you currently have, good or bad. Without the right foundation, the gap between what the QE function is asked to deliver and what it can deliver widens every month.
Buyer persona, journey, and operating models
The economic buyer: Head of Quality Engineering / Director of Quality CoE / VP of Engineering Quality
The leader who owns the quality outcomes of the engineering organization. Their title varies — Head of Quality Engineering, VP of Engineering Quality, Director of Quality Center of Excellence, Senior Director of Engineering Operations — and in some organizations the function reports to the CTO directly while in others it sits under Head of Engineering or a CIO. What's consistent: they own the program, they orchestrate across every product team, and they're measured on three outcomes simultaneously — release velocity, defect rate, and audit posture.
Velocity is often seen to be in conflict with the pursuit of quality — that quality necessarily slows things down. Fast feedback is the key, and velocity is the outcome. I worked at Apple, and that's exactly what you did — you would look at a date two years out, develop up until six months ahead of that, and then just test until everyone was badly bruised. We don't have to do that here.
The buyer sits at the intersection of multiple stakeholder groups. They partner with Engineering Leadership on velocity targets, with Platform Engineering on developer toolchain integration, with CISO and CIO on security and audit, with GRC on compliance evidence, with SRE on production observability, and increasingly with the AI/ML team on AI test generation and triage where one exists. The QE function isn't an island — it's the connecting tissue between "code shipped" and "customer impact," and the buyer is increasingly evaluated by leadership on whether that connecting tissue is fast, thin, and reliable.
Jobs to be done
Compress release cycle time by re-shaping the function so quality work runs in parallel with development, not after — turning the QE program from a velocity tax into a force multiplier.
Reduce escaped defects and customer-facing incidents by closing the gap between pre-release validation and production reality, so failures get caught before customers see them.
Make quality measurable across the portfolio so engineering leadership can see, at any moment, which services are well-tested and which are exposed — by team, by domain, by business unit, by criticality.
Generate audit evidence continuously as a structured output of the pipeline — test execution records, change approvals, deployment provenance, and policy conformance trails, all produced and timestamped as part of the work itself rather than assembled retroactively. Increasingly a regulator expectation under DORA, FedRAMP continuous monitoring, SEC cyber materiality disclosure, and PCI 4.0 — not a nice-to-have.
Reduce manual operational toil by automating the work that currently consumes engineering capacity — release checks, scheduled validations, post-deploy gates, and evidence assembly — so capacity returns to product work.
Ship AI-era applications safely by building test programs that anticipate agentic consumers and AI-assisted change rates, and by using AI itself to compound the function's productivity.
The journey
Every test artifact — whether authored by a human or an AI, whether it covers a contract, a workflow, an SLA, or a security check — moves through a version of the same journey. At each transition there's a friction point. The author can't write the test without the right context. The test doesn't run consistently as a gate. The gate that passes at PR time doesn't carry through to pre-release. The pre-release suite doesn't extend into production monitoring. The monitor's failure doesn't loop back into authoring the next test. Different people in the organization operate each stage, and most QE functions have never designed the journey as a connected system.
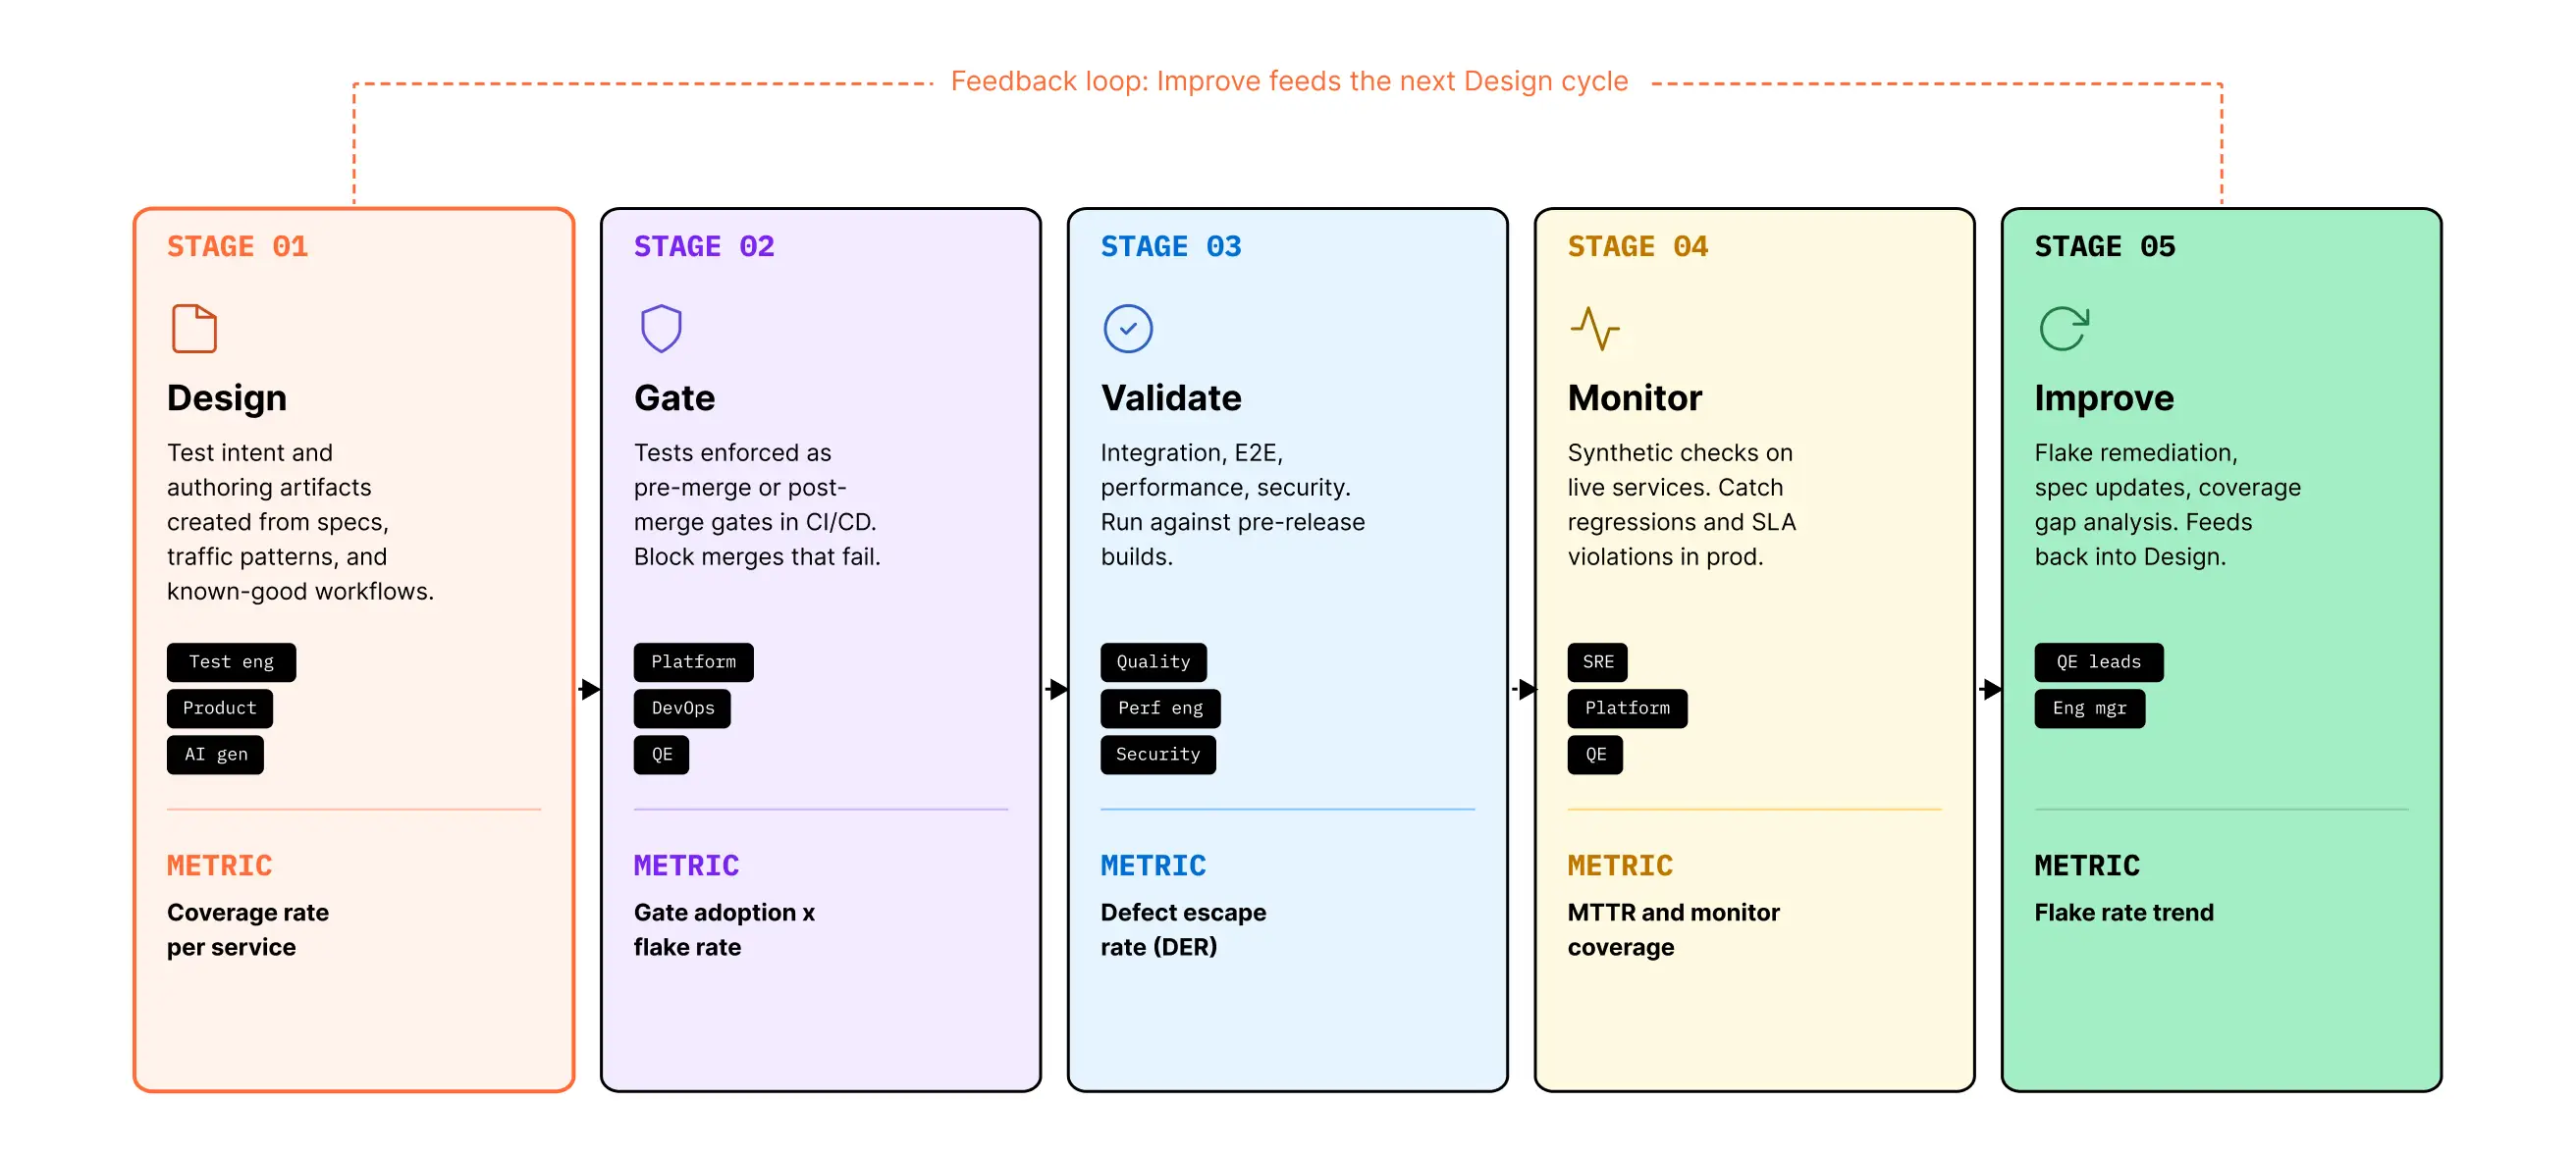
Design → Gate → Validate → Monitor → Improve
Design
Test engineers, product engineers, and increasingly AI generators create test intent and authoring artifacts from specs, traffic patterns, and known-good workflows. The audience here is the developer or QE engineer building the test suite. Today, authoring is dominated by manual work — engineers reading specs and writing tests by hand, often duplicating effort across teams because reusable patterns aren't easy to find. Coverage is uneven by design: high-attention services accumulate thorough suites while the long tail goes uncovered. The metric — coverage rate per service, especially for the long tail — is the leading indicator for everything downstream.
Gate
Platform Engineering, DevOps, and QE work together to enforce tests as pre-merge or post-merge gates in CI/CD. The audience is the developer pushing a PR and the build system that decides whether it can merge. Today, this is where most enterprise QE programs fall short — gates exist but cover only a fraction of changes; flaky tests get muted; bypass mechanisms accumulate; the gate becomes either too lenient or too strict. A weak Gate stage produces a false sense of security: PRs pass, then break downstream. The metric is gate adoption rate against gate flake rate.
Validate
Quality engineers, performance engineers, and security teams run larger suites — integration, end-to-end, performance, security — against pre-release builds in staging or ephemeral environments. The audience is the team deciding whether a build is ready to ship. Today, this stage is fragmented across tooling: a separate vendor for performance, another for security, another for E2E, with no shared evidence trail. Tests are slow, environments drift, results don't aggregate. A weak Validate stage either expands the pre-release window — a release that should take a day takes a week — or shrinks it dangerously, with teams skipping validation to hit deadlines.
We have a home-built tool for test automation that makes the end-to-end call for the particular API. We also have separate performance test tools. We are not particularly happy with our internal end-to-end testing tool. Complicated. It takes too long to set up. Only some people are able to utilize it. It has a fairly high frequency of failure when it has nothing to do with the API or the logic for that particular API.
Monitor
SRE, QE, and platform teams run synthetic monitors and scheduled validation runs against production, plus on-demand cloud-hosted automation triggered by deploys. The audience is the on-call team and engineering leadership reviewing posture. Today, this is where shift-right has the weakest tooling story — most monitors are simple endpoint pings, not journey-level SLA checks; cloud-hosted automation that should replace manual operational toil is either home-grown or absent. A weak Monitor stage means the gap between "passed pre-release" and "broke in production" stays invisible until customers report it. The metric is mean time to detect, for both functional and non-functional regressions.
Improve
QE and senior engineering leadership consume the feedback from every prior stage — failures, flakes, gaps, drift, escaped defects, audit findings — and feed it back into the next round of authoring. The audience is anyone with leverage to change the program. Today, this stage barely exists as a connected loop. Failures are triaged ad-hoc; flakes get muted instead of fixed; gaps get noticed in the post-mortem and forgotten before the next sprint. A weak Improve stage means the journey resets every cycle instead of compounding. The metric is change failure rate and escaped defect rate, both lagging indicators of how well the loop closes.
Three operating models for the journey
The journey above is the same regardless of organization — every test artifact moves through Design → Gate → Validate → Monitor → Improve. What differs is who owns each stage, who operates it, and where the boundary between central QE and product teams falls. Three distinct operating models show up in enterprise QE programs.
The pendulum always swings between distributed model and centralized model. We're swinging back to centralized. There's a testing center of excellence — anybody that looks or feels or smells like an SDET, they're getting slurped into that org. The challenge with those two things being separate was the level of quality was different, the tooling was different. So they'll still embed the testers with the teams, but they'll get their vision, direction, tooling choices driven centrally.
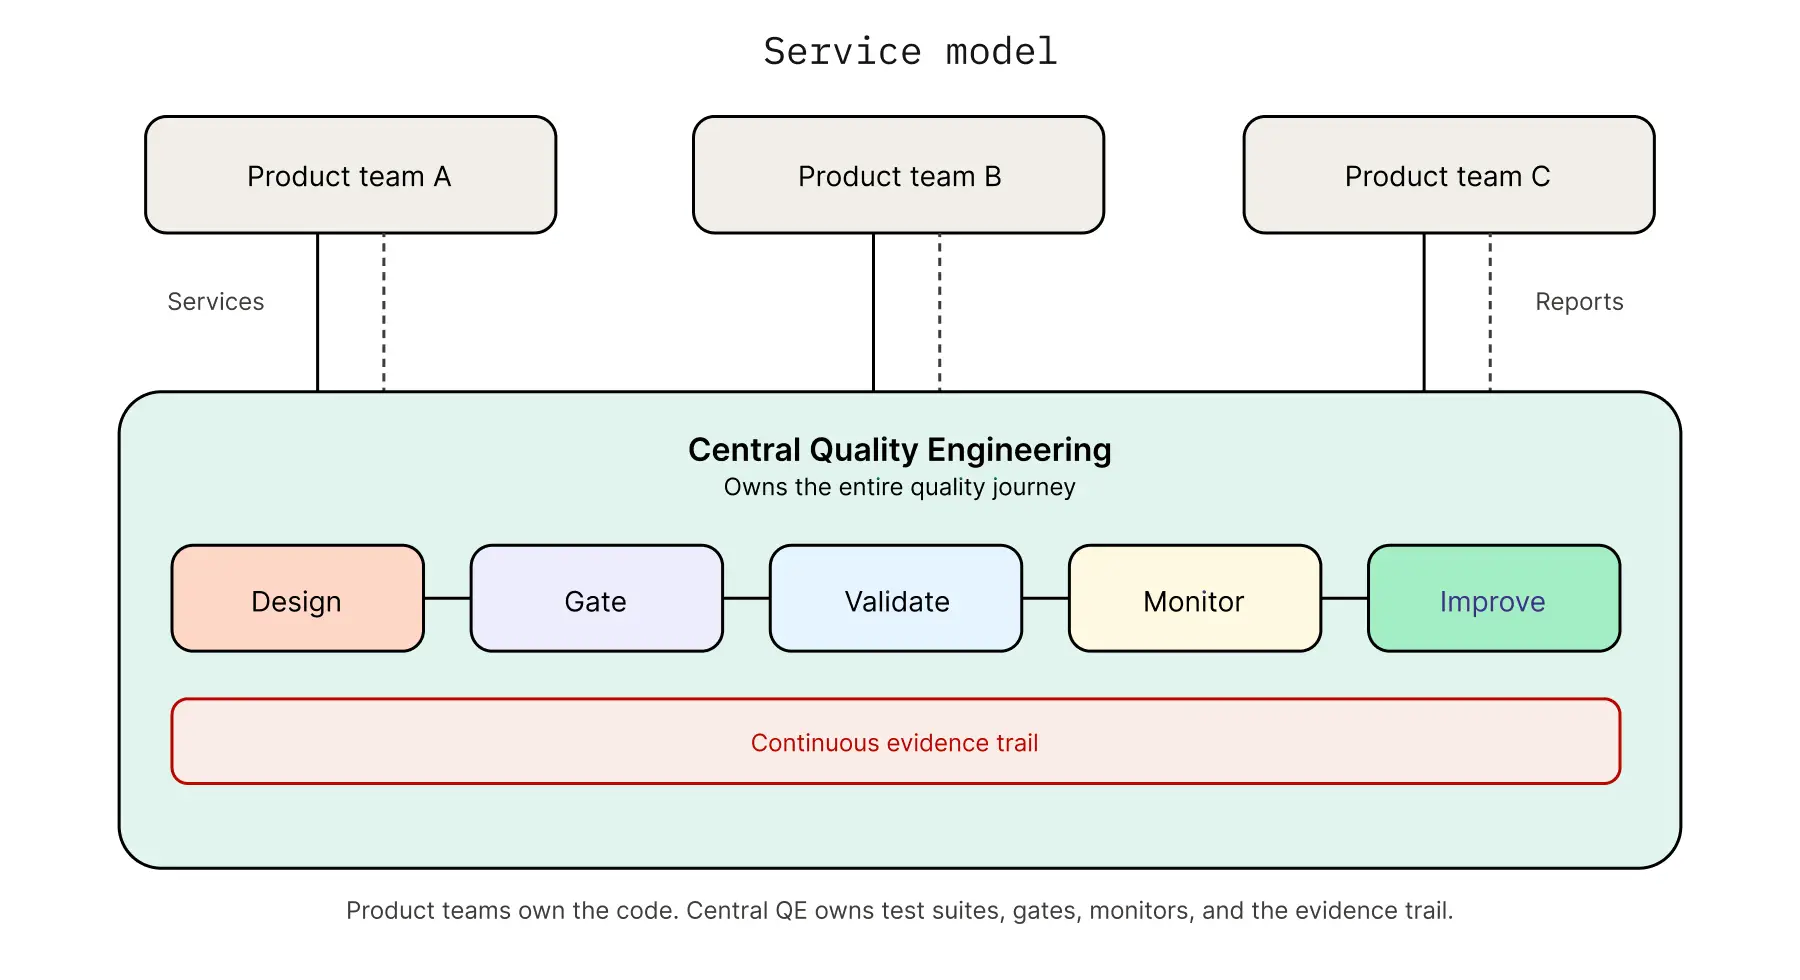
Service Model — Central QE
Central QE runs tests on behalf of product teams. Product teams hand over services and get back quality reports. QE owns the test suites, the gates, the monitors, and the evidence trail; product teams own the code. This is the dominant model in regulated industries — banking, insurance, healthcare — where centralized accountability is a charter requirement and where the QE function has traditionally been heavy enough to operate this way. The function looks like a service desk for quality.
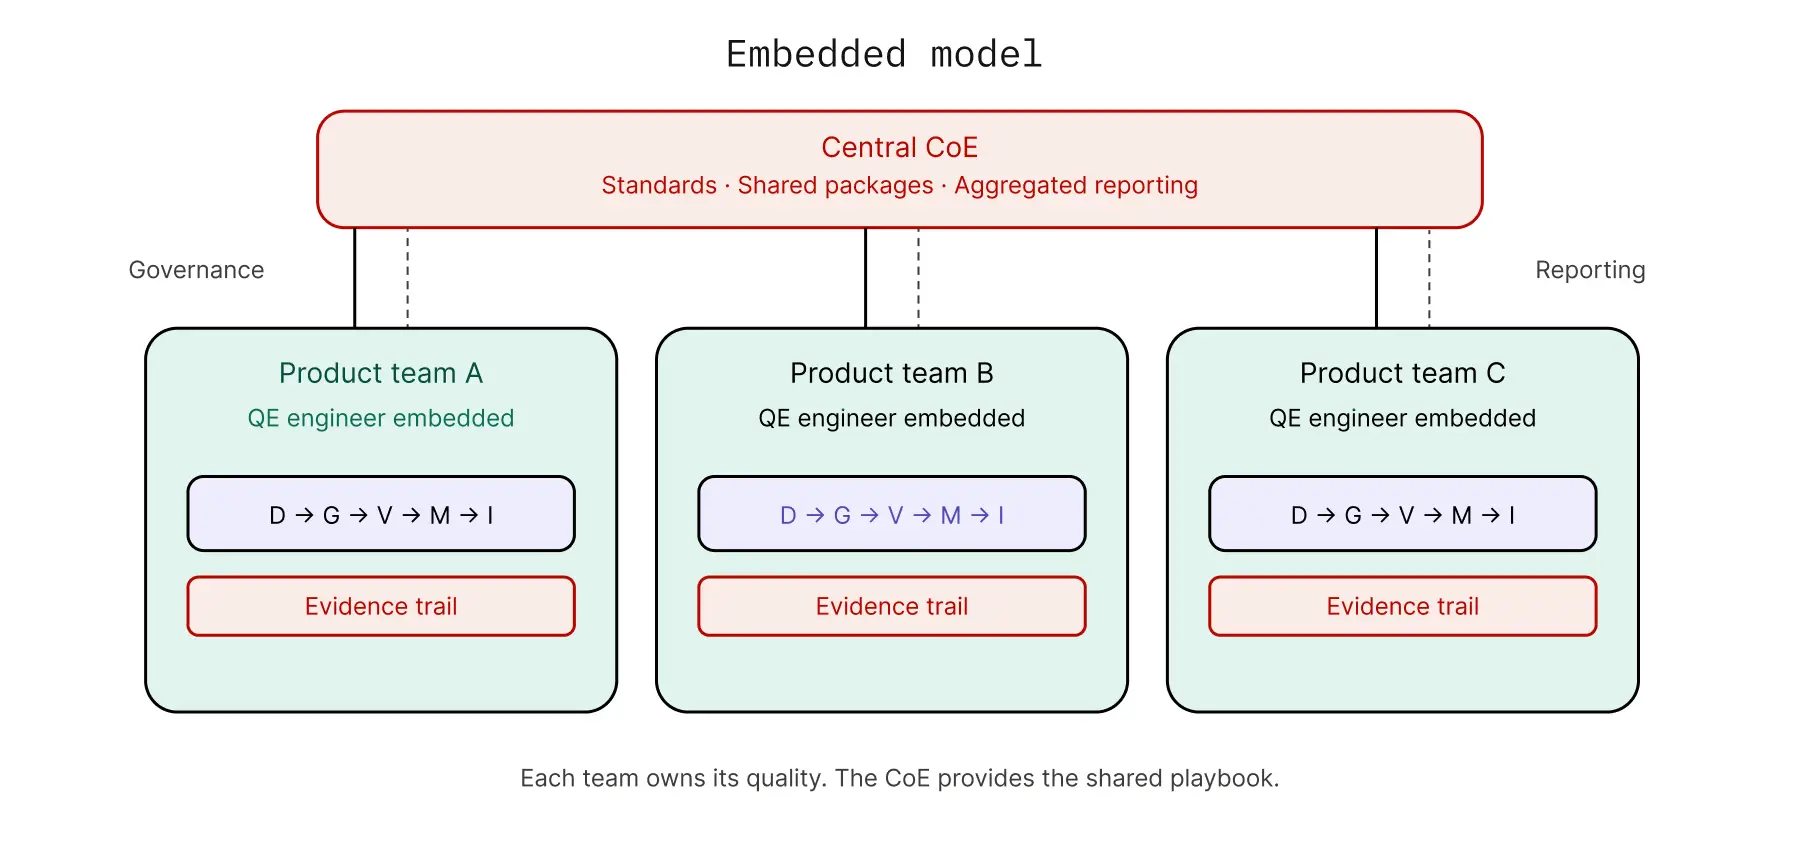
Embedded Model — Federated
QE engineers sit inside product teams. Each team owns its own quality while a central CoE provides standards, shared libraries, reusable test packs, and reporting. Distributed authoring with central governance. Common in mid-to-large product organizations that want quality to scale with the team rather than with a central function. The function looks like a network of practitioners with a shared playbook.
Platform Model — Self-Service
Central QE provides a self-service testing platform. Product teams own their own quality end-to-end with central guardrails — governance rules, gate definitions, reporting dashboards. The platform team's job is to make doing the right thing the easy thing. Common in modern, cloud-native, platform-engineering-mature organizations. The function looks like an internal product team serving developers as customers.
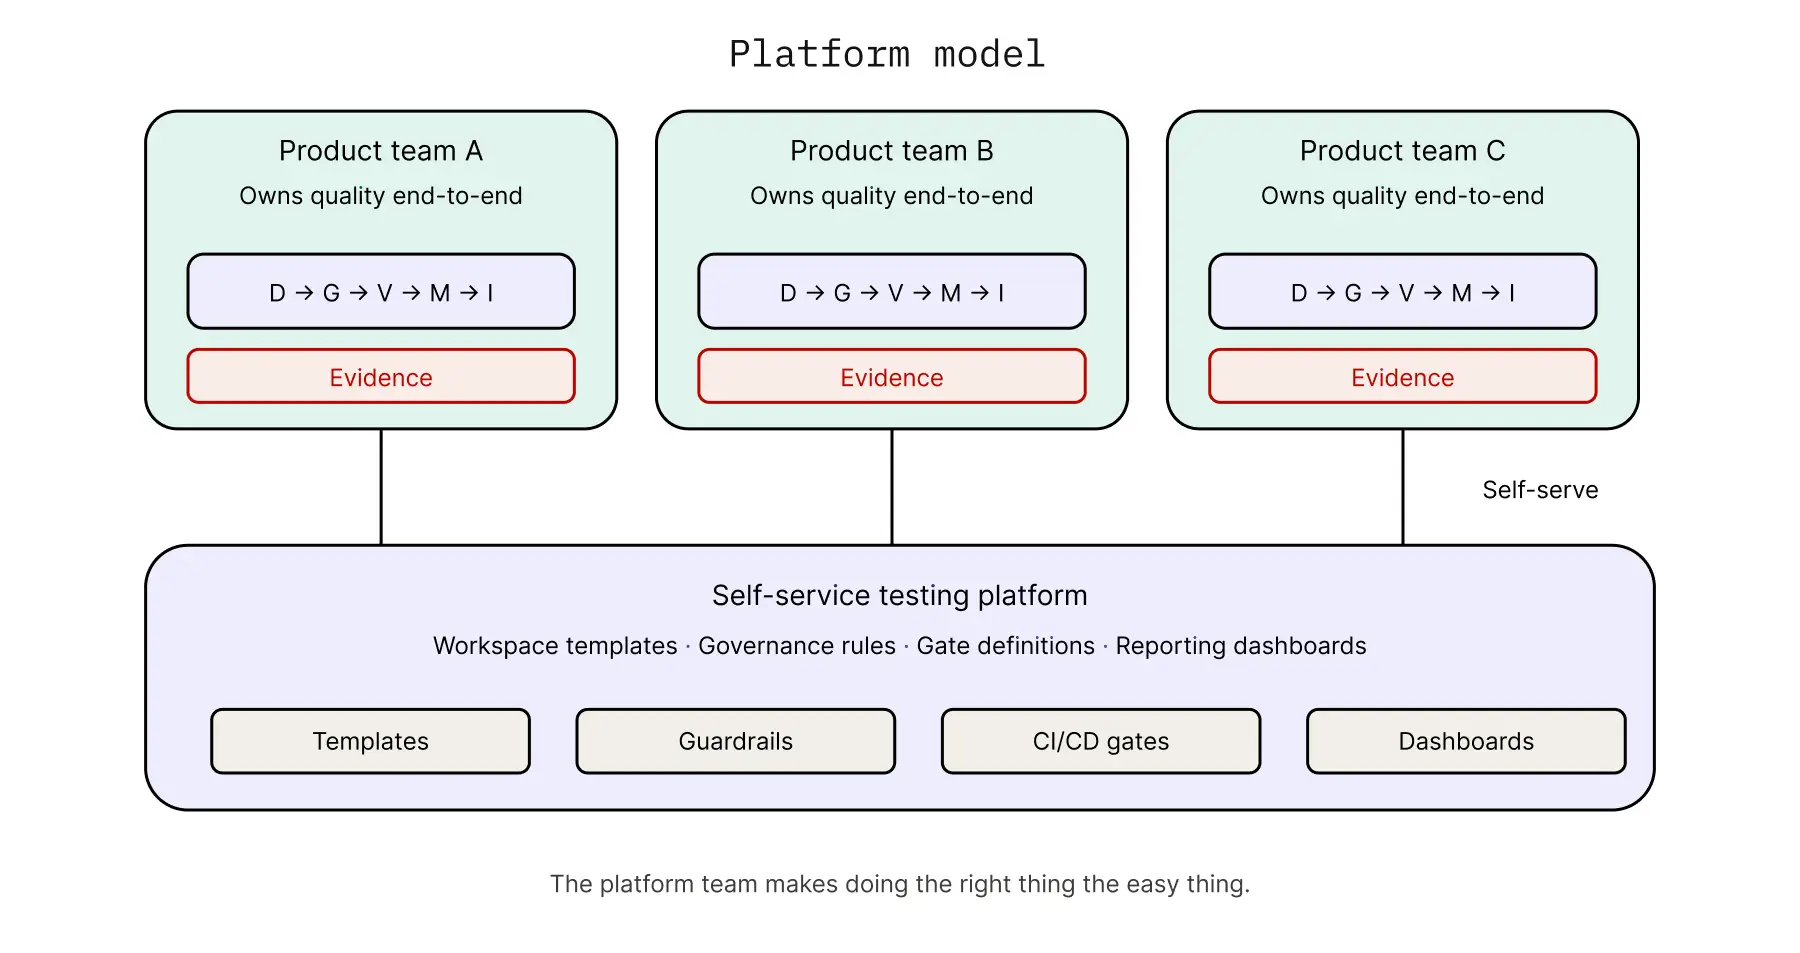
The journey is universal. The operating model determines who owns which stage.
Key metrics
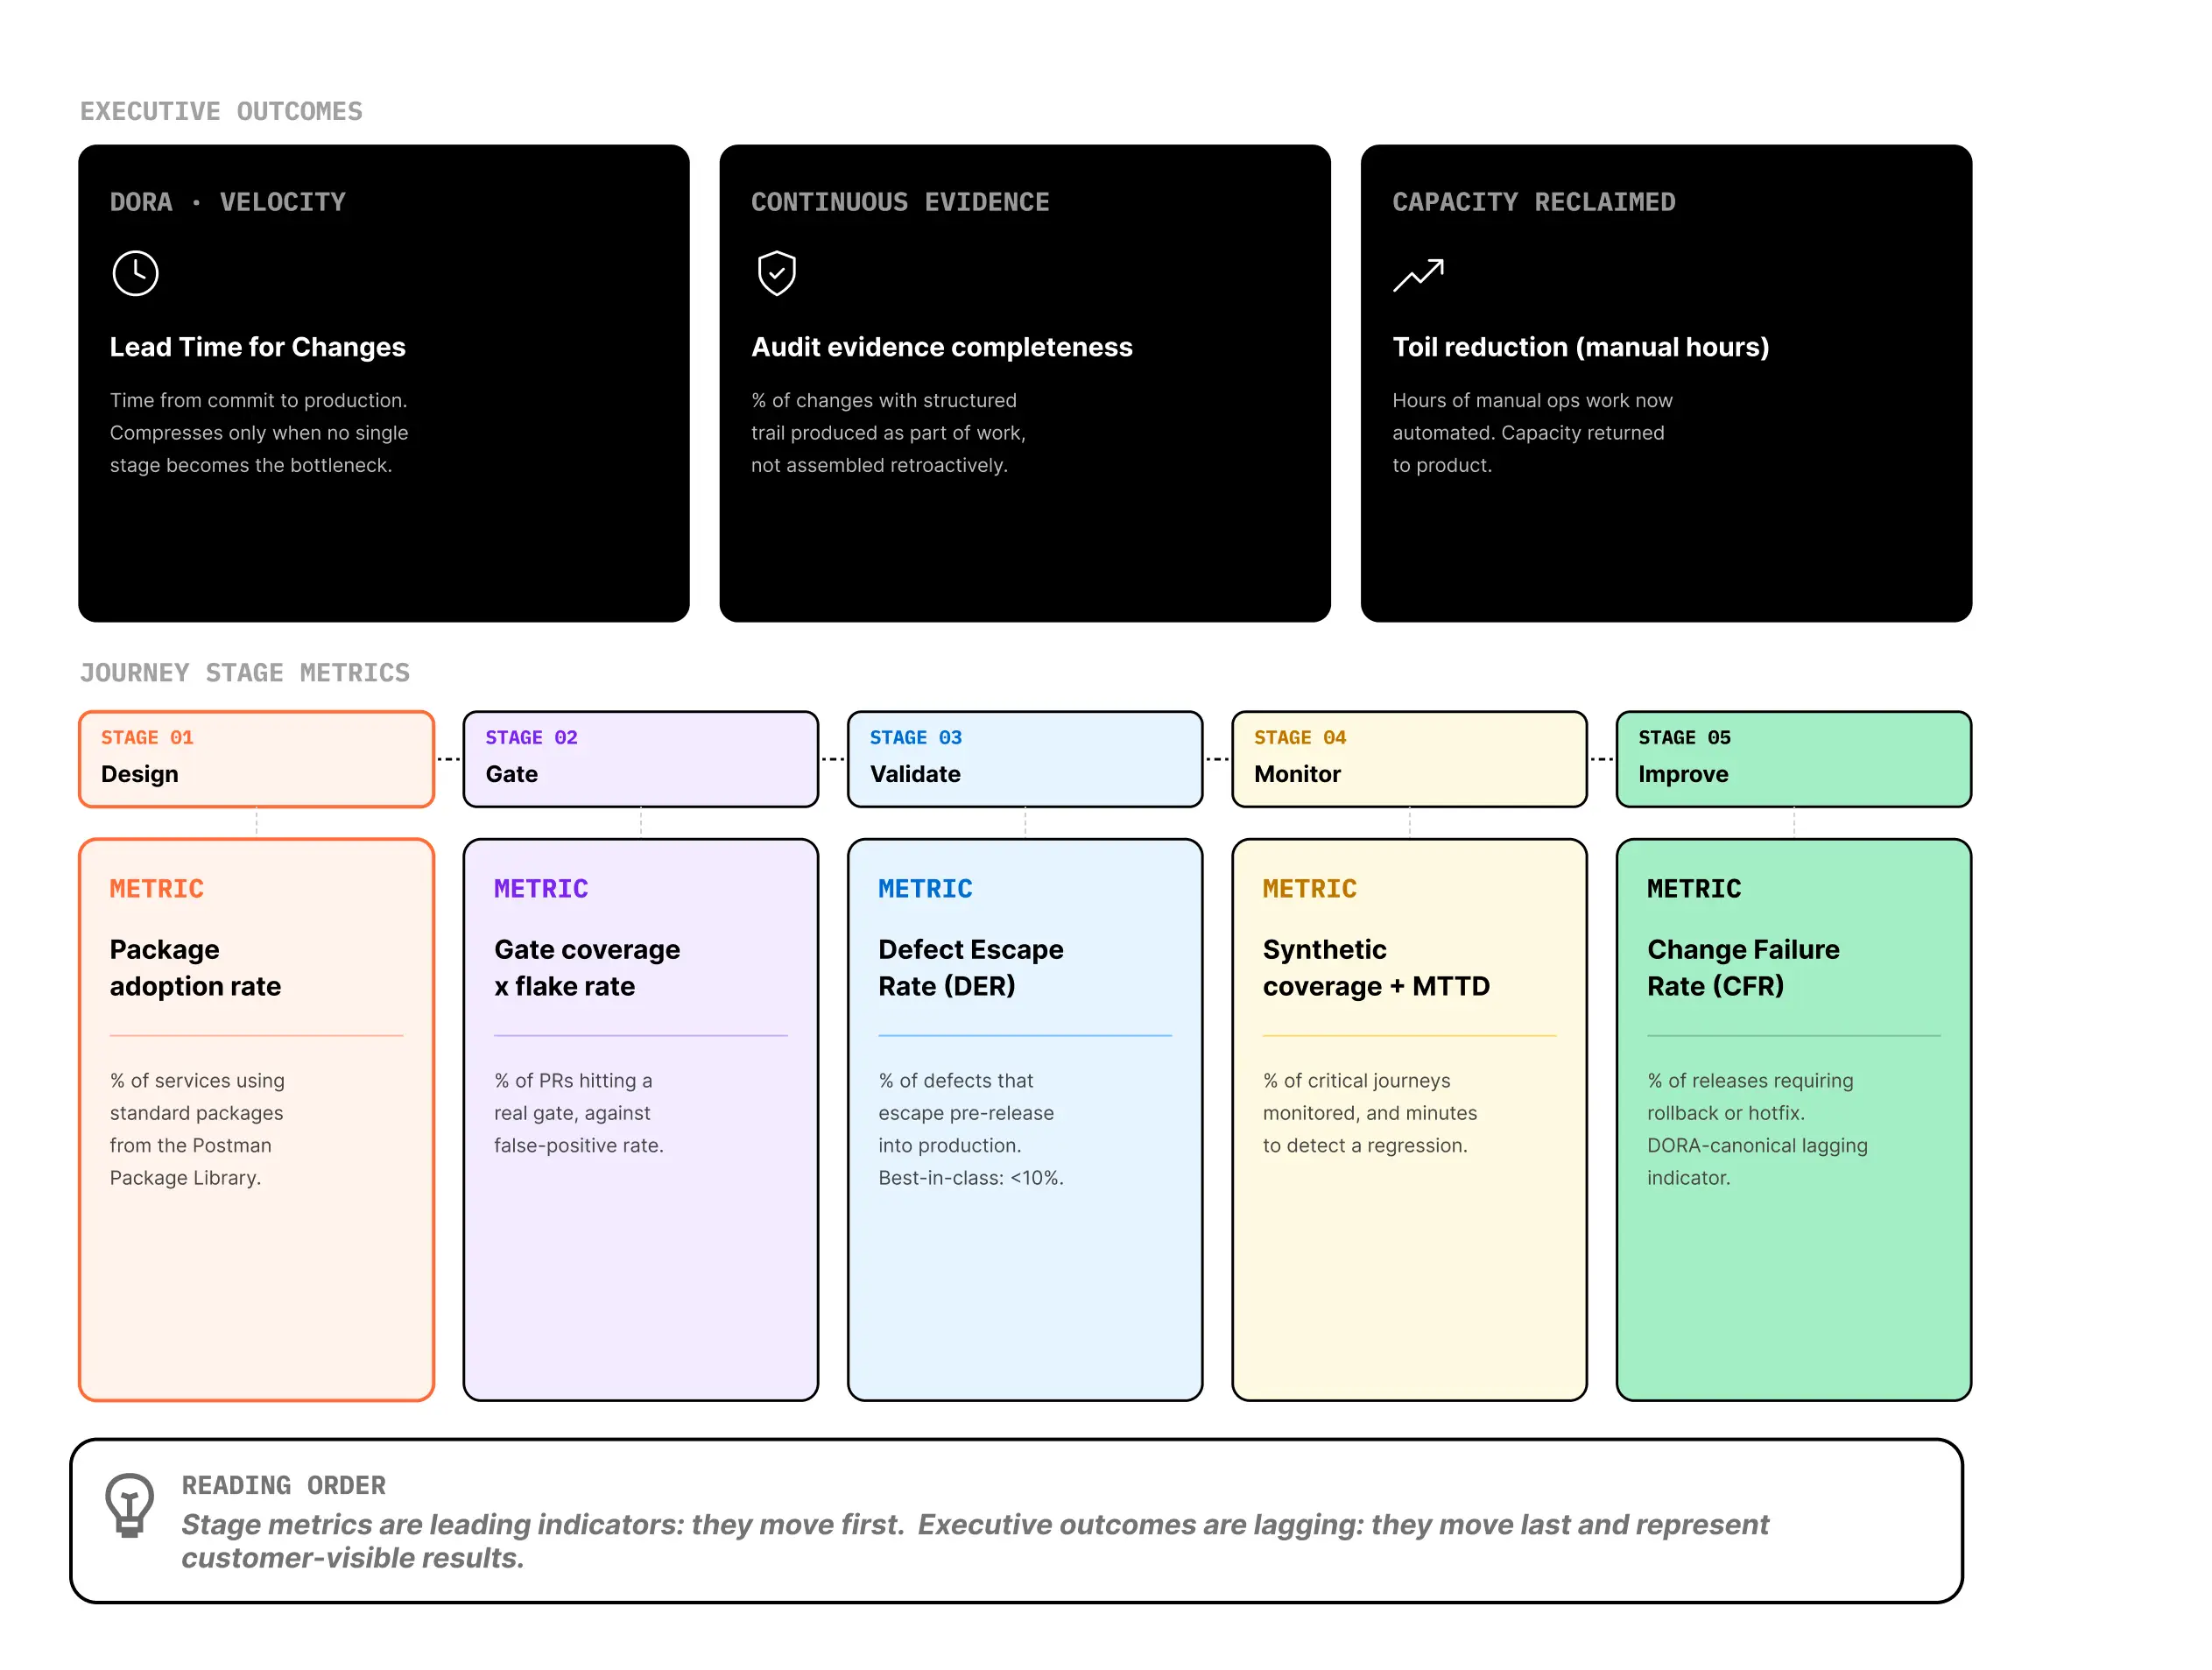
Five metrics form a diagnostic pipeline across the SDLC Automation journey. Each one measures whether a specific stage is healthy — and tells the QE leader where the pipeline is leaking when it isn't. Three cross-cutting outcomes ladder up from those stage metrics: the executive-level numbers engineering leadership reads to evaluate the program as a whole.
Delivering value faster has been the biggest challenge — what we call lead time to change, coming out of the DORA framework itself. We started this journey of objectively measuring software delivery two years ago. The second year we formally added it to the technology OKR — we track it monthly and quarterly.
Stage Metrics
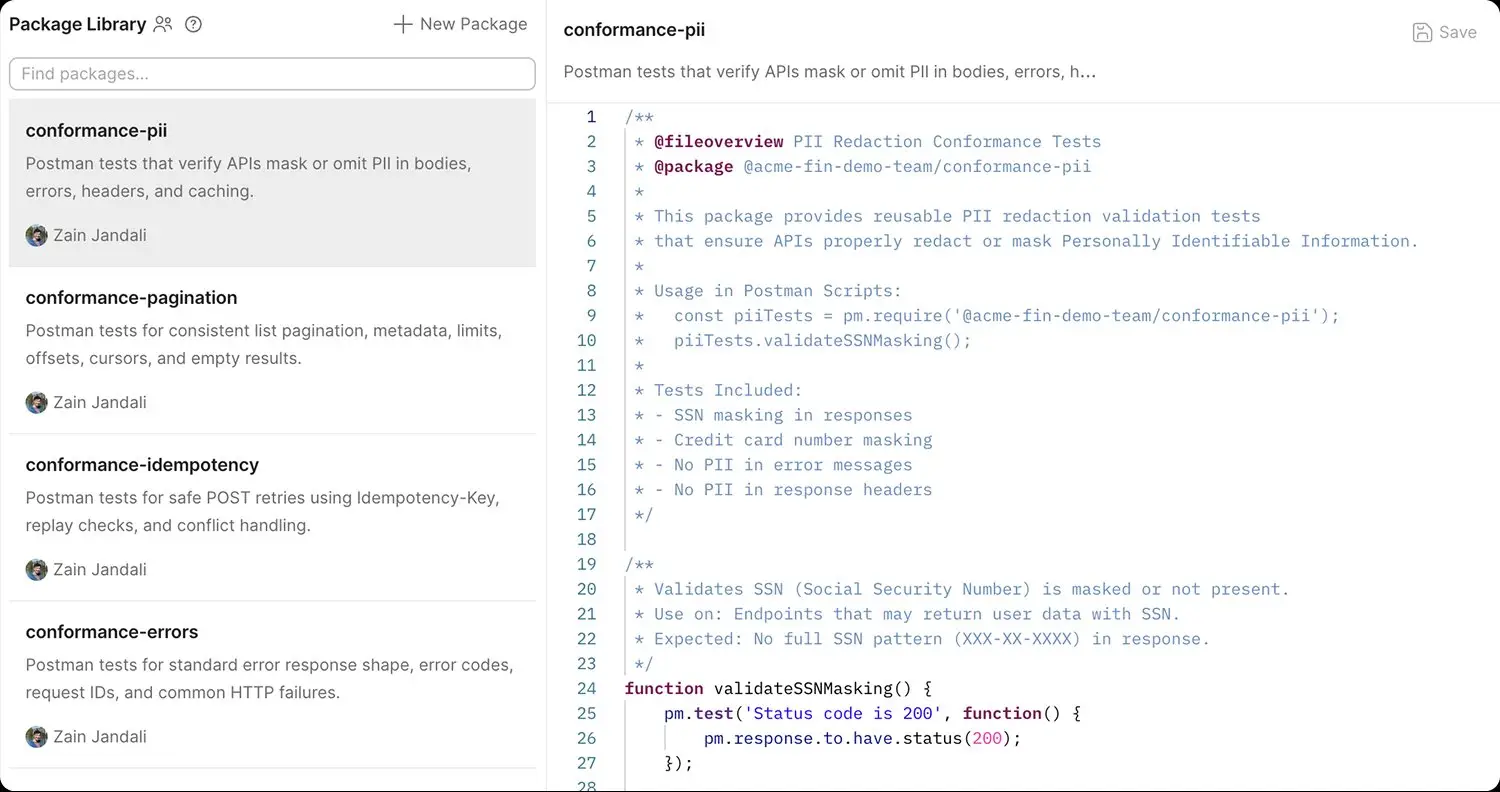
What percentage of services in the catalog have adopted the organization's standard packages from the Postman Package Library — auth checks, error contracts, idempotency tests, pagination handling, schema validation — as a baseline of specification coverage? This is the leading indicator that authoring is producing reusable, governable tests rather than bespoke per-team work. A low rate means the function isn't standardizing: coverage is uneven, tests rot in parallel across teams, and the long tail of services goes undefended. Best-in-class programs see adoption above 80% within the first year of a CoE rollout; programs without an active standard package typically sit below 25%.
Two numbers read together. Gate coverage tells you what percentage of PRs run a test suite that can actually block a merge. Flaky test rate tells you what percentage of those gates fire false positives. Industry-adjacent signals are build success rate (target above 90%) and pipeline gate block rate (healthy at 5–15%). A high coverage rate with a high flake rate means engineers are bypassing the gate or muting it — the gate exists in policy, not in practice. Low coverage means there's no real gate at all. The combination is the single best diagnostic for whether shift-left is working operationally or only on slides.
Of all defects found in a release, what percentage escape pre-release validation — integration, end-to-end, performance, security suites running against staging or ephemeral environments — and surface in production? Sometimes called defect leakage or the inverse of defect removal efficiency. Lower is better; best-in-class programs target DER below 10%, while many enterprise programs run at 30% or higher. This metric is also where multi-protocol fragmentation hurts most — programs validating only REST while their production estate includes gRPC, GraphQL, or async events report artificially low DER that collapses the moment a non-REST service has an issue.
What percentage of critical user journeys have synthetic monitors running end-to-end against staging and production — not just endpoint pings? And what's the MTTD when one of those journeys regresses? Best-in-class programs measure MTTD in minutes for critical journeys; many enterprise programs measure it in hours or days, often surfacing regressions only when a customer reports the problem. The gap between pre-release "passed all tests" and production "actually working" is where most escaped-defect stories live, and this metric pair is what closes it.
One of the canonical DORA keys, CFR is the percentage of releases that require a rollback, hotfix, or emergency patch. By the time CFR moves, the rest of the pipeline has either compounded or broken. Engineering leadership cares about it most because it represents customer-visible failure and operational risk — but it's the slowest to move, because it's the consequence of every prior stage working or not. CFR is also the metric where the forces from the Problem statement show up most clearly: AI-amplified change rates, multi-protocol surface drift, and undetected long-tail defects all converge here.
Cross-Cutting Outcomes
The five stage metrics are diagnostic — they tell you where to look. Three cross-cutting outcomes ladder up from them: the numbers engineering leadership reads to evaluate the program as a whole.
The master velocity metric — time from commit to production deploy, averaged across the portfolio. Sometimes called release cycle time or commit-to-prod time, but Lead Time for Changes is the canonical DORA term that engineering leadership reads against industry benchmarks. Compresses when every stage of the pipeline gets faster, and stays compressed only when no single stage becomes the bottleneck. A QE program that doesn't move Lead Time for Changes is failing its mandate, regardless of how the stage-level metrics look.
What percentage of changes in a given window have a complete, structured evidence trail — test execution records, change approvals, deployment provenance, policy conformance — produced as part of the work itself rather than assembled retroactively? DORA EU explicitly requires audit-ready documentation and continuous compliance evidence; FedRAMP 20x is moving toward persistent validation — security objectives encoded and continuously verified, not point-in-time attestation. A high score means audit prep is a query, not a project; a low score means quarter-end scrambles continue indefinitely.
Hours per quarter previously spent on manual operational work — release checks, scheduled validations, evidence assembly, support escalations from undocumented test failures — that now run automatically. Toil is the SRE term of art (Google SRE book) for manual operational work that scales linearly with service growth; the QE function inherits much of it. Increasingly, this is the metric engineering leaders use to justify QE platform investment in cost-constrained environments: not "we'll catch more bugs," but "we'll free up X engineering FTE-equivalents of operational work to redirect to product."
Do I spend my time completing reports for audit, getting my next release out — even though when you look at the grand scheme of things, creating an automated test suite for regression might make everything faster for the next five years? You still have to stop what you're doing and complete it.
The pipeline: Each metric feeds the next. A low package adoption rate means fewer services have standard test coverage, which means fewer gates have meaningful tests to run, which means more defects escape validation, which means monitors are the last line of defense for a surface they weren't designed to cover, which means CFR stays stubbornly high. You don't need to fix all five at once. You need to find the bottleneck and fix that.
Why Postman
Why Postman is uniquely positioned
40 million developers globally are trained on consuming and testing APIs through Postman. Across the platform, billions of API requests execute daily — for development, testing, monitoring, and automation. For most organizations, Postman is already where developers go to make their first API call, debug a failing integration, or share a known-good workflow with a teammate. The QE function isn't introducing a new tool; it's leveraging the tool the developers already use.
It's a quick adoption — testers and developers have been previously using it. It's an easy transition from the legacy world to Postman.
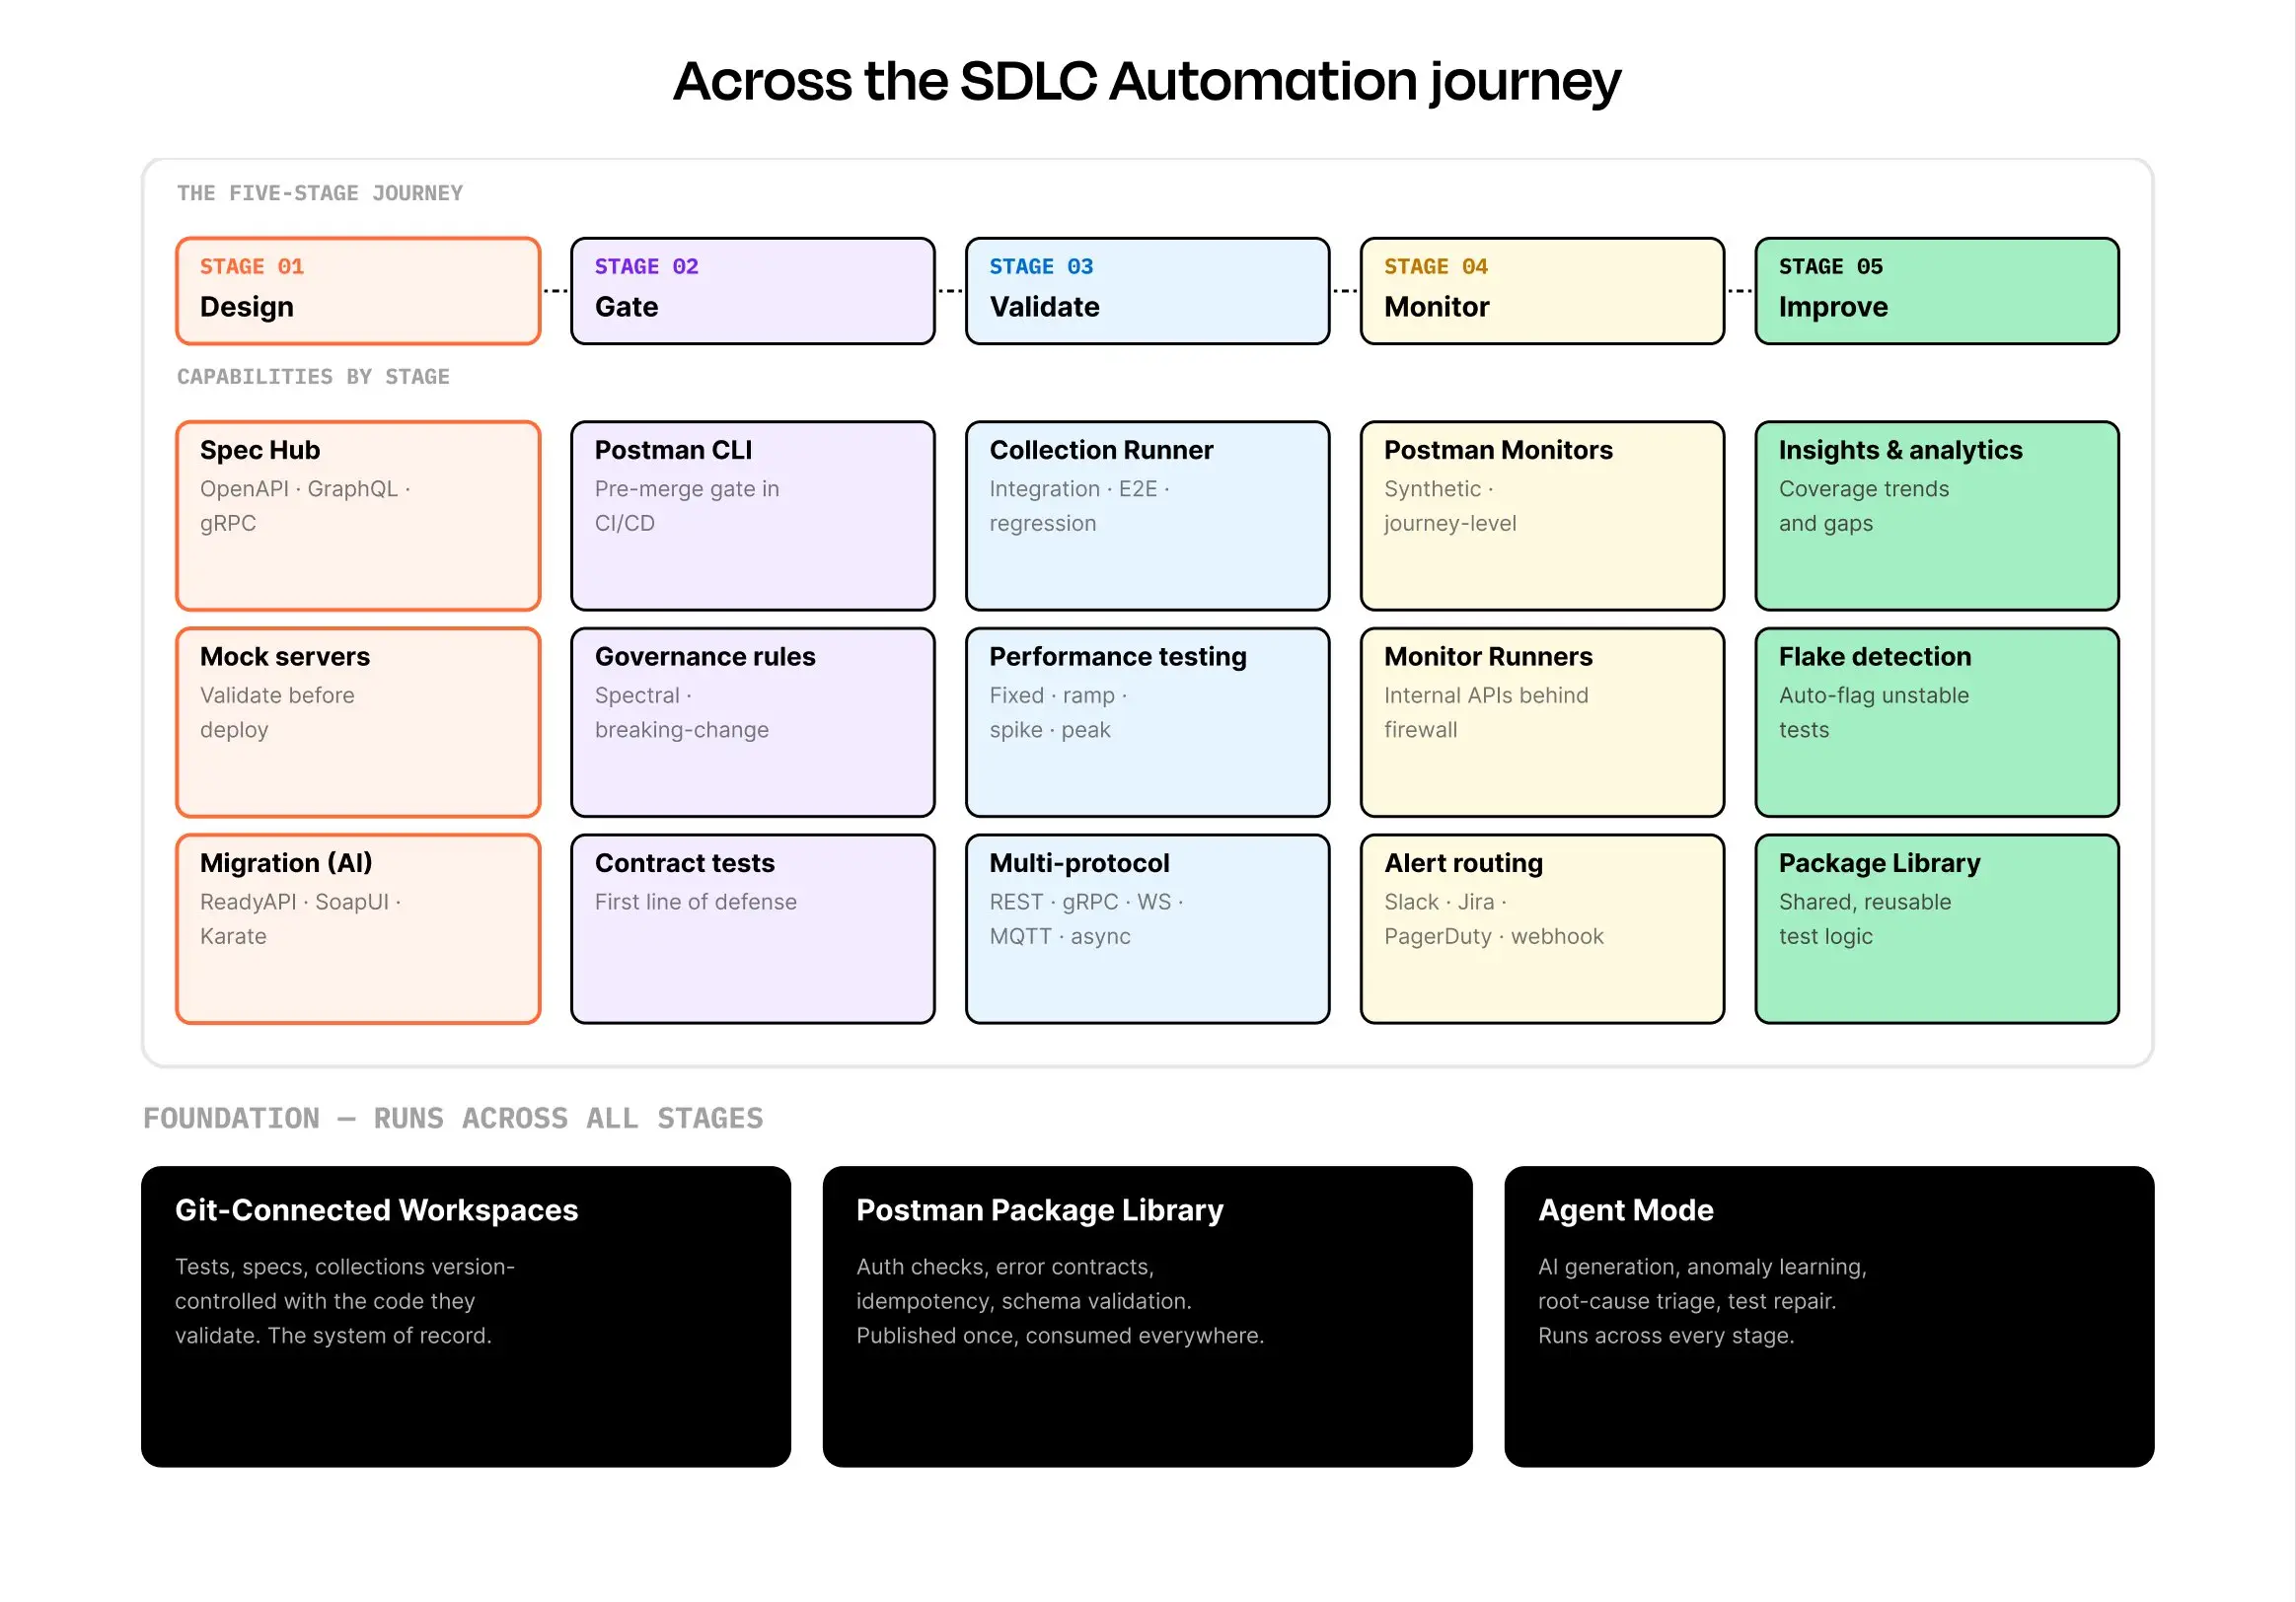
Postman has spent over a decade building capabilities that map directly to the SDLC Automation journey: Workspaces for scoped collaboration; Spec Hub for spec-driven workflows; Collections as executable test artifacts; Postman CLI for CI/CD integration; Mock servers for pre-release validation; Monitors for synthetic SLA enforcement; the Postman Package Library for reusable scripts and tests; test and performance reports for executive scorecards and audit evidence; Agent Mode for natural-language test generation, triage, and repair; Insights for traffic-driven gap detection; and native multi-protocol support across REST, GraphQL, gRPC, WebSocket, MQTT, SOAP, and AsyncAPI.
And critically, Postman v12 now offers Git-Connected Workspaces — tests, specs, and collections version-controlled with the code they validate. This is the foundation that makes everything else cohere: tests live with the code, run on every surface, and gate every dimension.
Design Stage
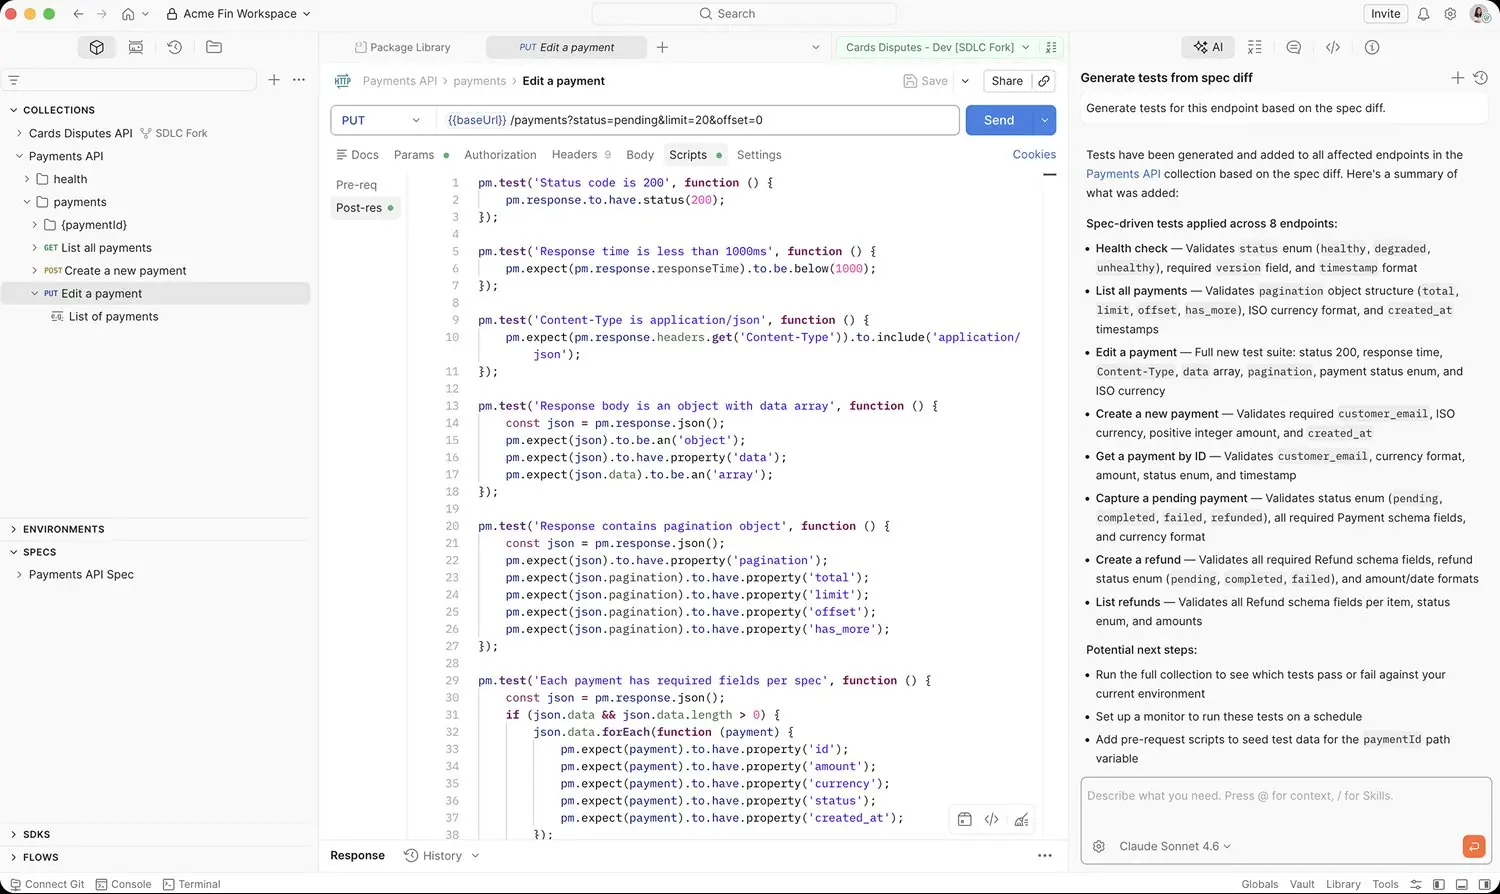
Test authoring is increasingly spec-driven and AI-assisted. Spec Hub gives the QE function a single surface for managing OpenAPI, GraphQL, and gRPC proto definitions — and Postman generates baseline test scaffolding directly from those specs, eliminating the manual "translate spec to test" step that consumes engineering capacity. Agent Mode expands coverage from spec diffs, traffic patterns, and known-good workflows. Reusable packages published to the Postman Package Library — auth checks, error contracts, idempotency tests, pagination handling, schema validation — give every new service a baseline of standard tests on day one and govern themselves through versioned, team-shared scripts. External packages from npm and JSR registries can also be pulled in. For organizations migrating from ReadyAPI, SoapUI, or Karate, an AI-powered migration path translates legacy projects to native Postman collections — preserving assertions, variable chaining, data-driven loops, and scripts. The Design stage is where AI compounds most visibly: every authored test enriches the workspace, and every enriched workspace produces better next-test generation.
Gate Stage
Postman CLI runs in any CI/CD pipeline as a pre-merge gate. Contract tests, governance rules (Spectral lint), and standard packages from the Package Library all execute on every PR, with results posted back to the PR for inline developer feedback. Workspace governance rules — naming conventions, schema standards, breaking-change detection — enforce in real-time as developers work, not in a review queue. The gate is where shift-left becomes operationally real instead of architecturally aspirational.
Validate Stage
Pre-release validation pulls together what most QE programs run as separate vendor stacks. Postman's named test types — integration, end-to-end, regression, and performance — all run from the same workspace, against the same artifacts, with results aggregating into a unified evidence trail. Mock servers let teams validate against an API contract before the real service is deployed, critical for organizations with downstream dependencies. Multi-protocol native support means validation isn't limited to REST: gRPC, GraphQL, WebSocket, MQTT, and AsyncAPI services all run through the same harness.
Postman started off with prerequest and post-request testing and really upped its game — regression testing, monitoring with health checks, data-driven testing with hundreds if not thousands of data sets in a CI/CD pipeline, and recently performance testing. We're going to see a full API test cycle within Postman.
Monitor Stage
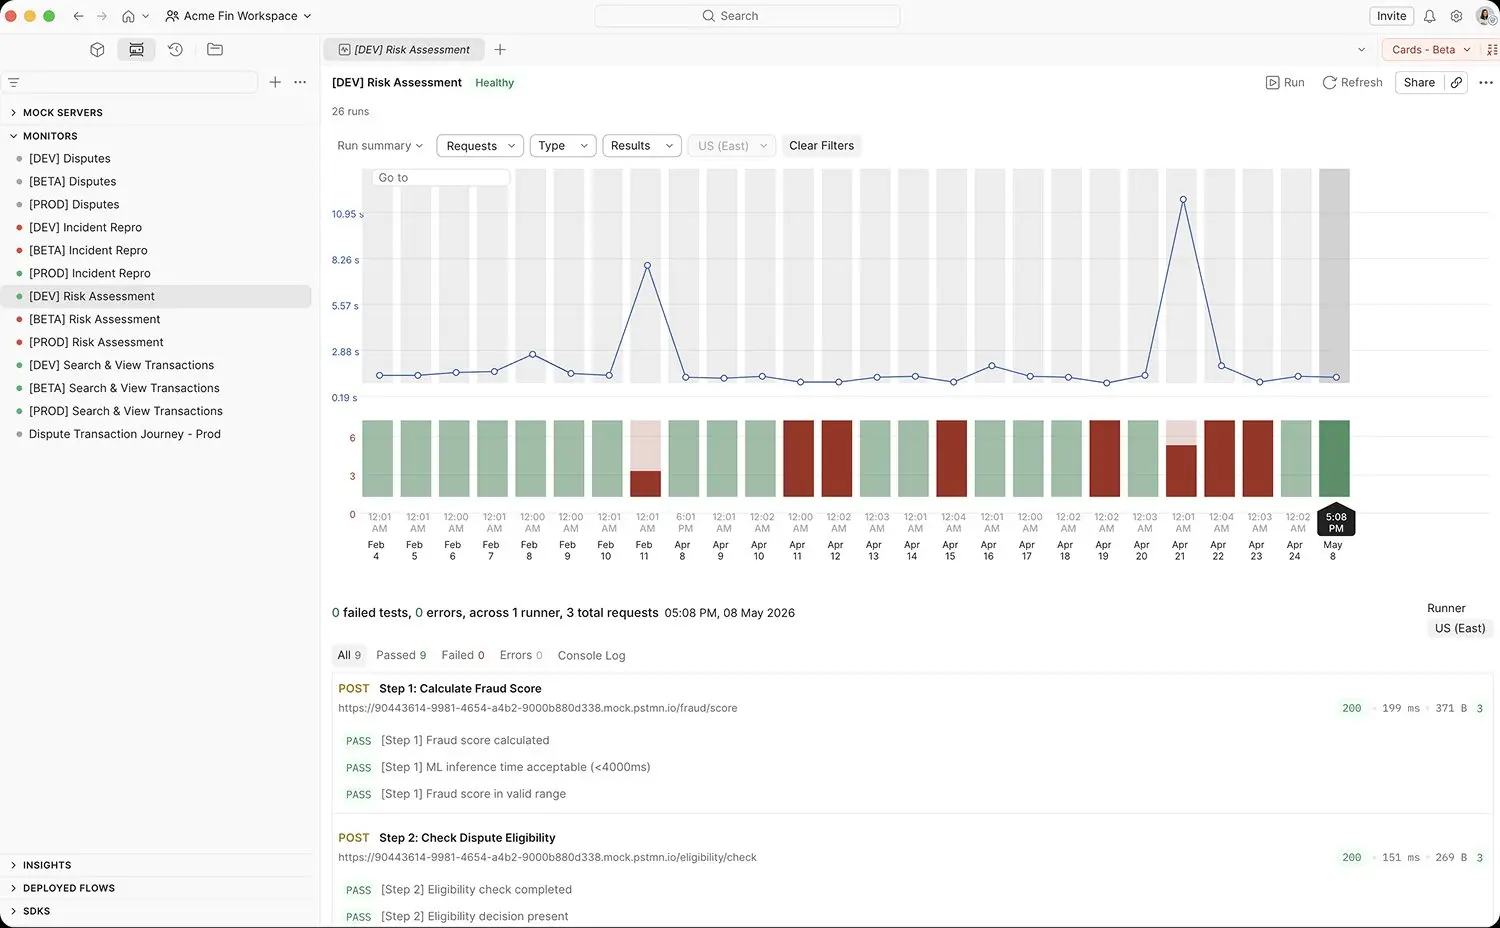
Postman Monitors run synthetic checks against staging and production on schedules from every minute to every day, executing the same test artifact authored upstream — no separate monitoring tool to wire up, no separate test code to maintain. Journey-level monitoring chains multiple requests into a single end-to-end flow, capturing the customer-perceived path through the system rather than just endpoint pings. Critically for enterprise QE programs, Monitor Runners let Postman Monitors execute against internal/private APIs behind firewalls — a capability most synthetic monitoring tools don't have, and the difference between "we monitor what's public" and "we monitor everything that matters." Failures route to Slack, Jira, PagerDuty, or any webhook — and link back to the monitoring run with reproducible execution context for the on-call engineer.
The goal is to have those collections run automatically. But there are restrictions on the Postman side to the cloud-based monitoring. So if it is an internally hosted application, we can't run a scheduled run. But if it is publicly hosted APIs, then we can run the scheduled test.
Improve Stage
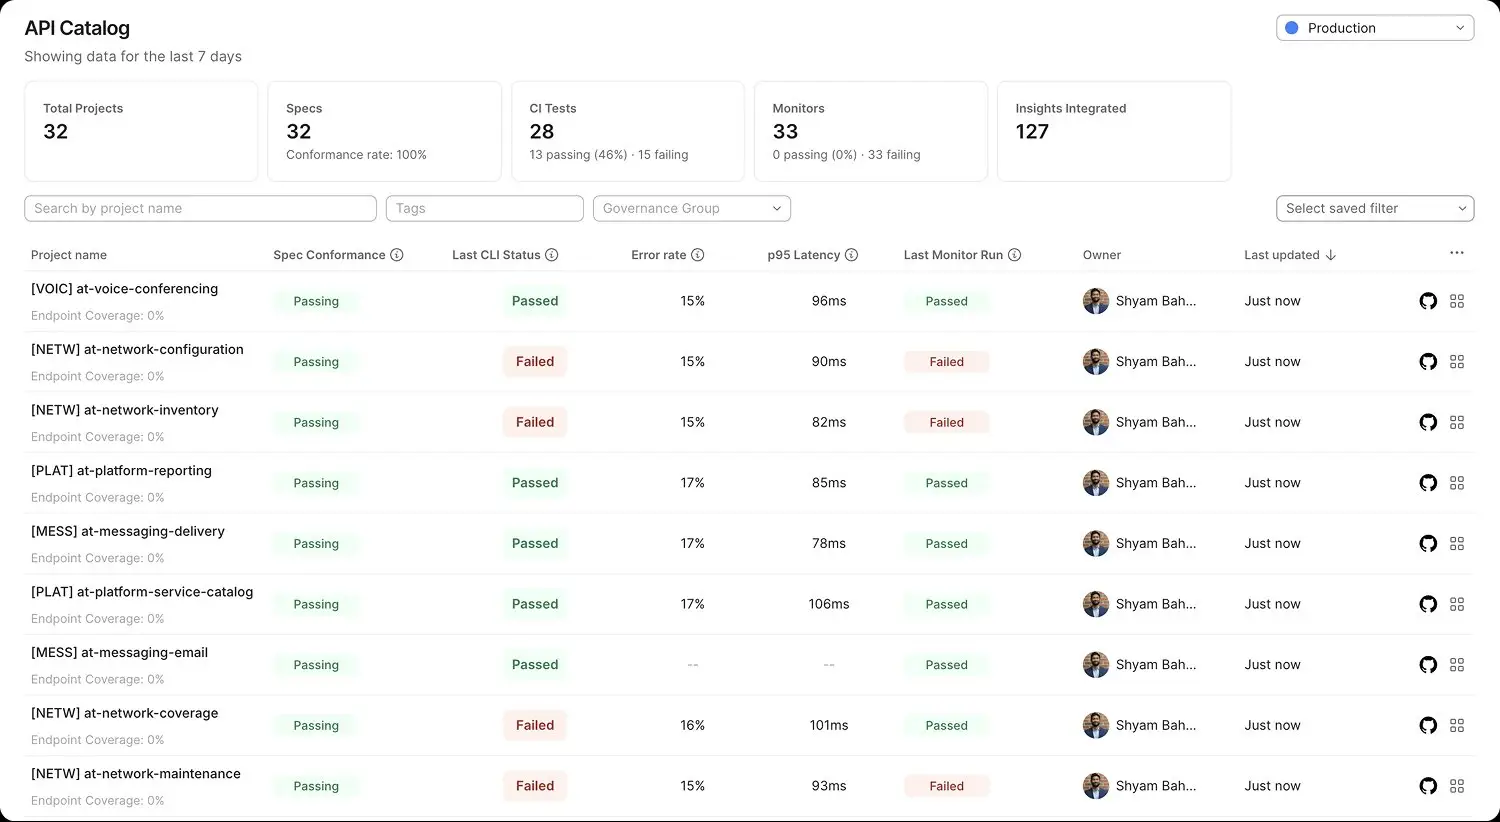
Test and performance reports give engineering leadership and the QE function a portfolio-level view of every metric in Chapter 2: package adoption, gate coverage, defect escape rate, synthetic coverage, change failure rate, and the cross-cutting outcomes. Postman AI allows for surfacing of failure patterns and proposes root-cause diagnoses, and repairs existing tests when the underlying contract has changed — directly addressing the "tests rot faster than they're maintained" problem. Insights uses production traffic to identify coverage gaps — endpoints called in production but absent from the test suite, response patterns the tests don't cover. The Improve loop closes when these signals automatically generate proposed test additions for the next Design cycle.
Here are my test cases — where are my AI tools that help me turn these into automated tests? How do I get these things put into my pipeline? How do I get my regression test suites going? I have these libraries, but as things change, I need people to update the libraries.
The full spectrum of testing in Postman
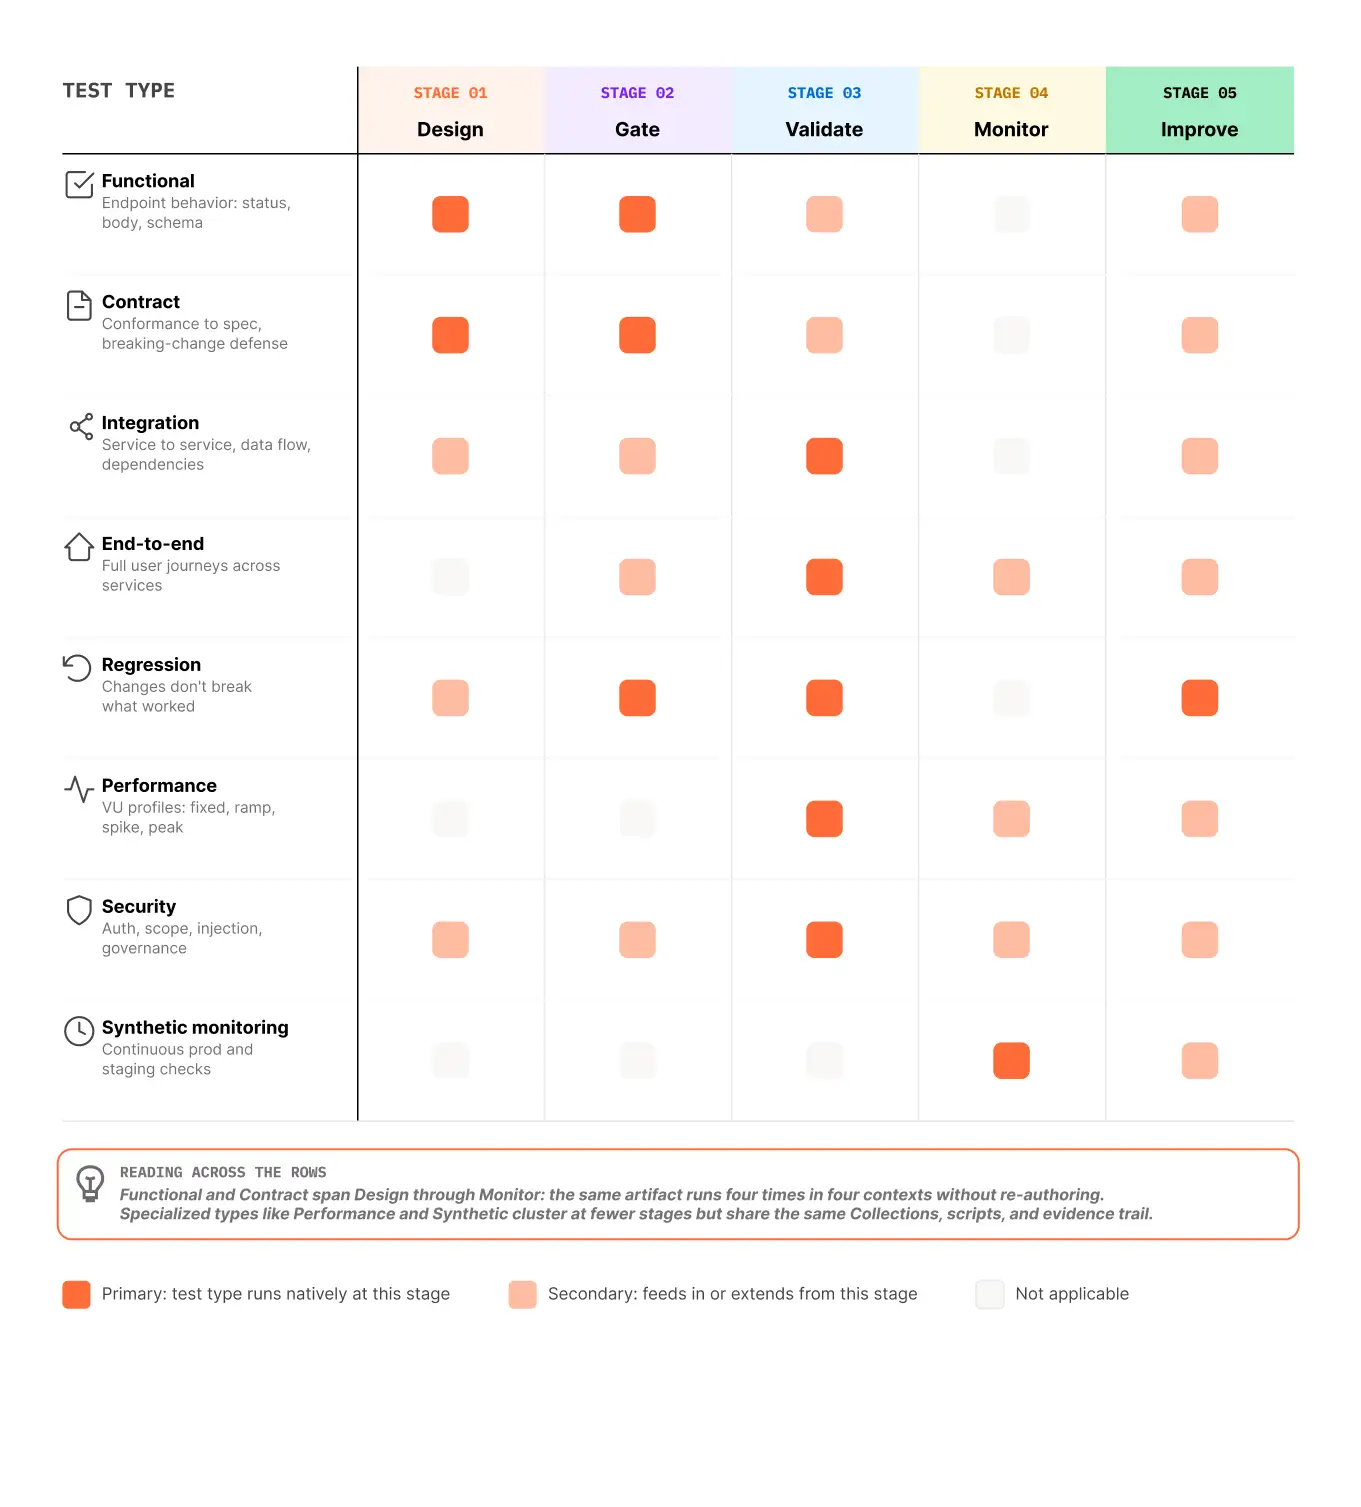
The journey above walks the QE function through stages. The orthogonal view is the kinds of testing the function actually has to perform — and where most QE programs fragment into separate vendor stacks. In Postman, the same Collections, the same scripts, the same environments, and the same execution surfaces cover the full spectrum.
One workspace. Eight test types. Five stages. Same artifact throughout.
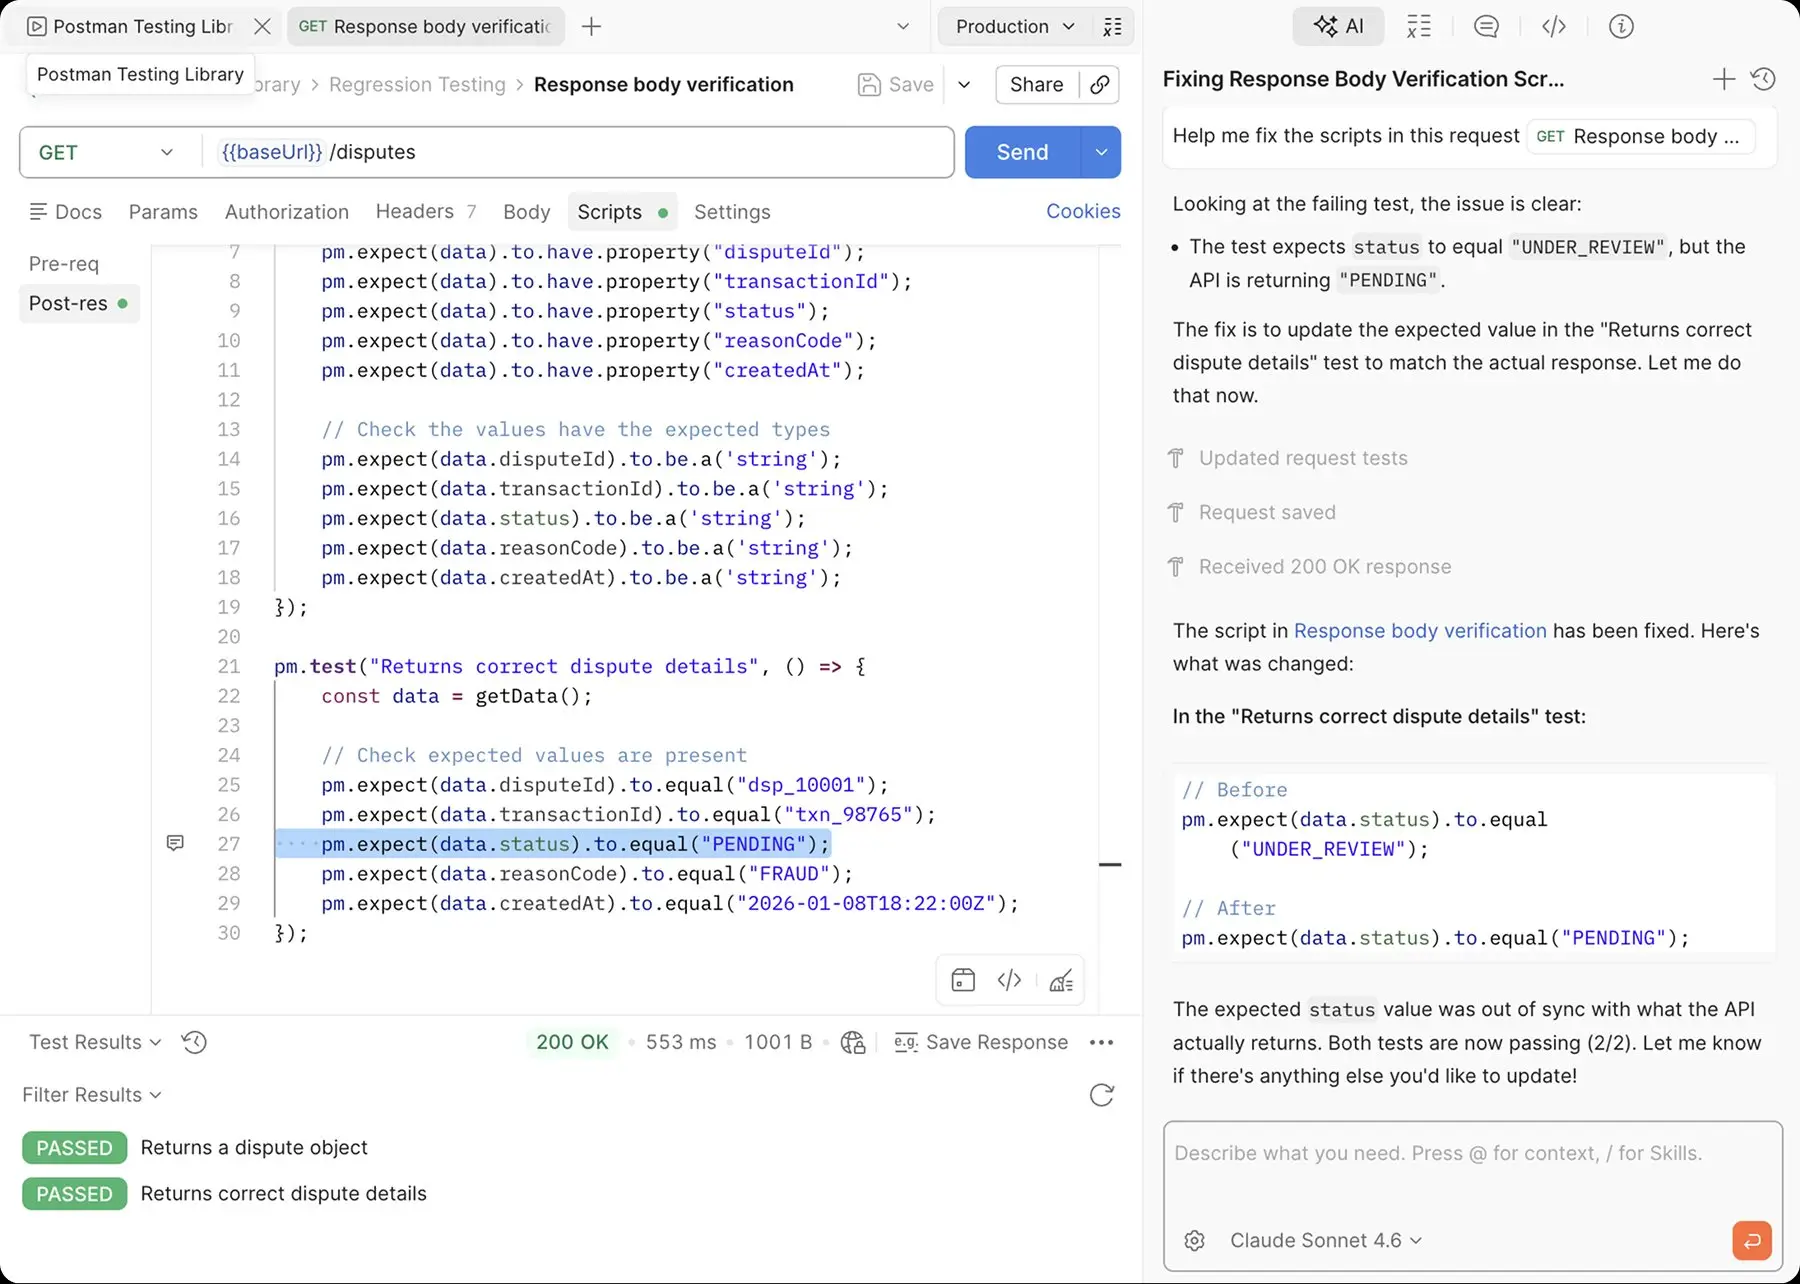
Functional testing validates that an API endpoint behaves as specified — correct status codes, response bodies, headers, schema conformance. The atomic unit. Every Collection request can carry post-response scripts written in JavaScript on the Postman Sandbox (Node.js runtime) using the Chai.js assertion library; pm.test() and pm.expect() are the primitives.
Contract testing validates that an API conforms to its specification. The first line of defense for breaking-change detection, especially in microservices and cross-team estates where producer and consumer teams move on different cadences. Postman generates baseline contract tests directly from specs and runs them as gates in CI/CD or as scheduled validations.
Integration testing validates how API components, services, and external systems work together — data flow, dependencies, downstream behavior. Postman Collections chain requests in sequence, pass data between them, and switch environments to validate the same workflow against dev, staging, and production. Mock servers stand in for dependencies that aren't available yet.
End-to-end testing validates full user journeys — the sequence of API calls a real user or client triggers from start to finish, often touching multiple services. Collections chain end-to-end flows with branching, looping, and conditional logic via scripts. The same artifact runs locally, in CI/CD, and as a production Monitor.
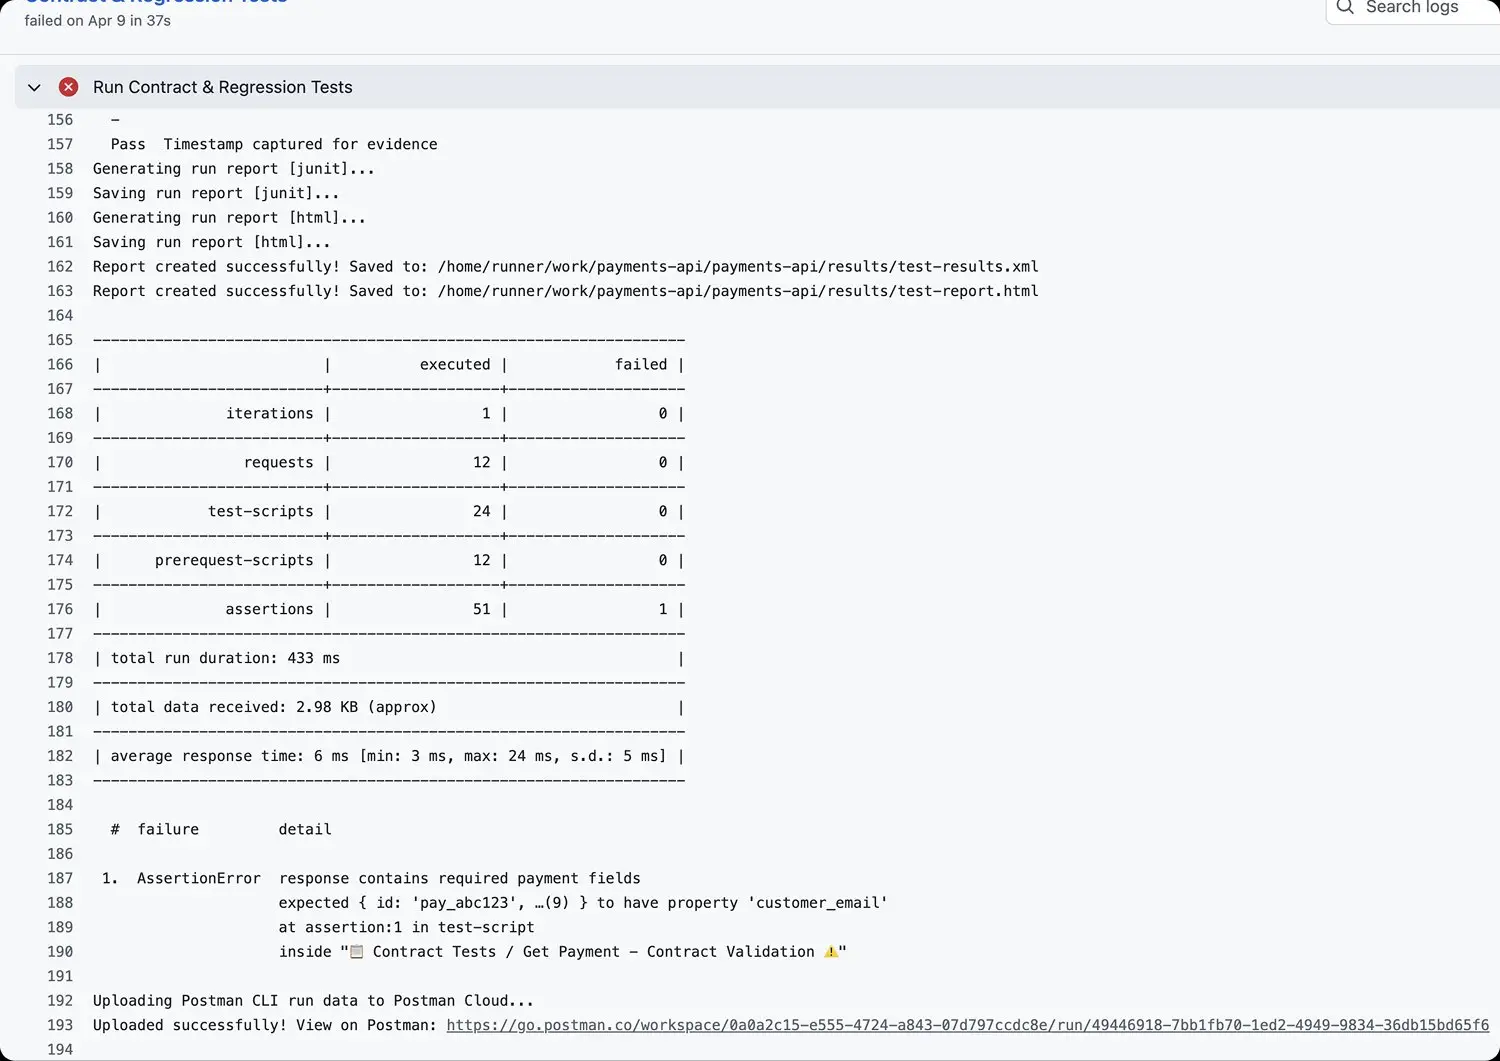
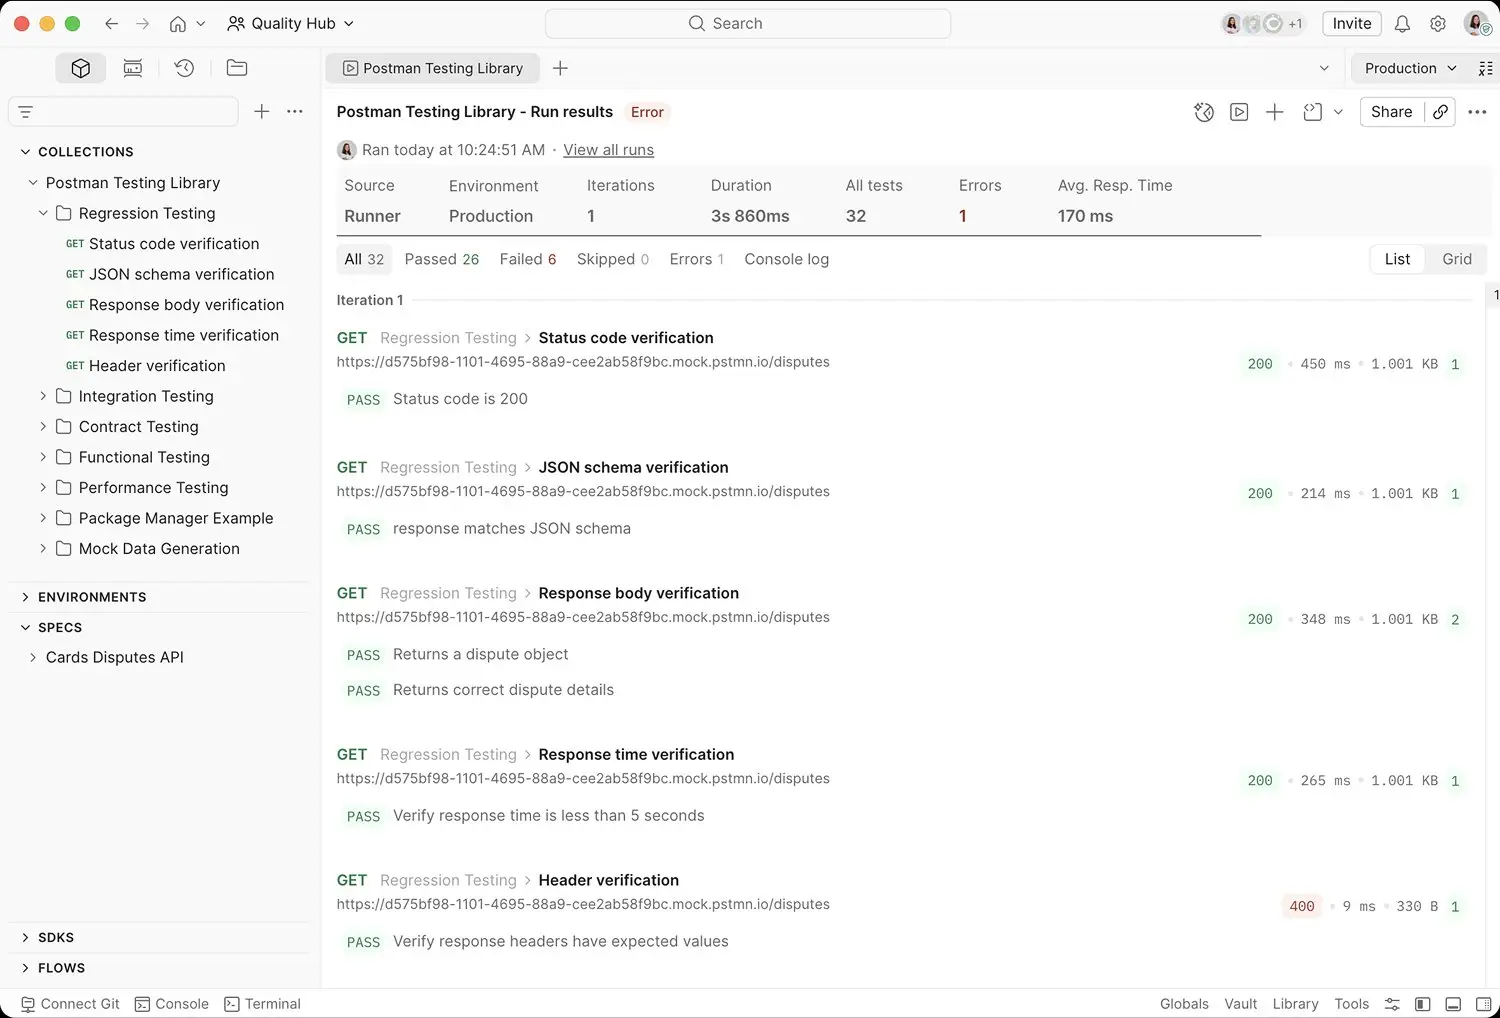
Regression testing ensures changes don't break previously working functionality. Regression suites cover status codes, JSON schema, response times, response bodies, and headers. Postman CLI runs them on every PR; the Collection Runner runs them on schedule. Agent Mode repairs regression tests when the underlying contract has changed — addressing the "tests rot faster than they're maintained" problem at the test-maintenance layer.
Performance testing simulates real-world traffic with virtual users (VUs). Four named load profiles — Fixed, Ramp up, Spike, Peak — cover steady load, gradual ramps, sudden spikes, and sustained peaks. Pass/fail criteria are configurable on average response time, p90 latency, throughput (requests per second), or error rate. Performance tests reuse the Collections already authored for functional testing, so authoring effort doesn't double.
Security testing validates auth flows, scope enforcement, and common injection patterns. Postman's request and scripting model lets QE teams encode security assertions — proper rejection of invalid tokens, scope mismatch, malformed payloads, SQL or script injection — as standard tests in the same suite. Spectral governance rules can also enforce security baselines (HTTPS-only, required auth, no plain credentials in specs) at design time.
Synthetic monitoring runs the same tests continuously against staging and production from outside the system, simulating real user traffic. Postman Monitors execute Collections on schedules from every minute to every day. Monitor Runners enable synthetic monitoring of internal and private APIs behind firewalls — a capability most synthetic monitoring tools don't have, and the difference between "we monitor what's public" and "we monitor everything that matters."
Different test types. One workspace. One set of artifacts. The same authored Collection that gates a PR runs as a regression check on the next release, as a load test before peak season, and as a synthetic monitor in production. Adding a new test type to a service's coverage doesn't require a new vendor, a new framework, or a new authoring environment — it requires a new Collection, with scope for essential reuse using Postman's Package Library.
Architectural principle: tests live with the code, run on every surface, gate every dimension
Through Git-Connected Workspaces, every test artifact lives next to the code it validates — the same way unit tests do. The same test artifact executes locally during development, in CI/CD as a release gate, on a schedule via the Collection Runner, and as a synthetic Monitor in production. The same gate covers functionality, performance, and security — not three separate tools producing three separate verdicts.
No re-authoring between gate types. No drift between what the developer wrote, what CI ran, what the monitor checks, and what the auditor sees. The Git workspace is the testing system of record; every consumption surface — IDE, Postman CLI, Collection Runner, Monitors, reports — reads from it.
This is what makes the cross-cutting properties of the QE program automatic rather than aspirational:
- Continuous evidence. Every test execution — local, CI, scheduled, synthetic — produces a structured audit-ready record. Audit prep becomes a query against the evidence trail, not a quarter-end project.
- Standardization through reuse. Packages from the Postman Package Library — containing curated test logic, assertions, and scripts — get published once and consumed everywhere. The CoE doesn't build N copies of the same thing for N teams.
- Multi-protocol parity. The same workspace, the same gate, the same monitor run against REST, GraphQL, gRPC, WebSocket, MQTT, and AsyncAPI. No protocol gets second-class treatment, and the seams between protocol-specific tools — where most coverage actually leaks — disappear.
This is the differentiator against DIY (which always drifts, because no internal team has the engineering capacity to keep N tools in sync) and against point solutions (which never share artifacts across stages, because each vendor owns its own format).
AI across the pipeline
AI doesn't replace the QE function. It amplifies whatever pipeline you've built — for better or worse. The same pattern that holds for AI-readiness of consumed APIs holds for AI-amplification of QE: rich context produces compounding leverage; thin context produces compounding failures.
Postman's AI capabilities extend across every stage of the journey, sharing the workspace as their context layer:
- Design — generation. Agent Mode generates test scaffolding from specs, expands coverage from spec diffs and traffic patterns, and translates legacy tests during migration. The quality of generated tests scales with the workspace's content: rich examples and curated packages produce strong tests; thin context produces hallucinated ones.
- Gate — governance assist. AI-assisted lint and governance rules complement deterministic Spectral checks: naming conventions, schema standards, and breaking-change detection that pattern-match rather than rule-match.
- Validate — anomaly learning. AI baseline learning for performance and behavioral drift. The system learns what "normal" looks like across runs and flags deviations that static thresholds would miss.
- Monitor — pattern recognition. Anomaly detection on synthetic monitor results and production traffic; correlation across journey-level monitors to surface emerging issues before they become incidents.
- Improve — root-cause triage and test repair. Postman's upcoming Autonomous Engineer does failure triage with proposed root causes, drawing on the workspace's context: upstream spec changes, related service deployments, historical failure patterns. It also repairs existing tests when the underlying contract has changed — turning the Improve loop from manual rework into automated maintenance. AI gap analysis identifies coverage holes from spec-vs-traffic diffs.
The underlying workspace context is what makes AI-generated tests produce real coverage instead of plausible-looking noise. Without rich context, AI test generation produces tests that pass for the wrong reasons; with rich context, AI compounds the QE function's productivity in a way that linear team scaling cannot match. The workspace is the context pack, and the context pack is what makes the AI work.
Three patterns for deploying SDLC Automation
The capabilities above apply across all three operating models from Chapter 1 — Service, Embedded, Platform — but the workspace strategy differs. Three patterns capture how Postman gets deployed in practice.
Pattern 1 — Hub-and-Spoke (Service model)
A central Quality Hub workspace owns standards, the Package Library, governance rules, and the executive reporting surface. Per-service Test Workspaces inherit from the Hub, run their own gates and monitors, and contribute back to the shared evidence trail. Common in regulated industries with strong central QE charters: banking, insurance, healthcare. The hub is the system of record; product teams interact with it through standardized contributions.
Pattern 2 — Federated (Embedded model)
Each product team or domain owns its own Postman workspace, with all five journey stages running locally. A central CoE publishes shared libraries — packages, governance rules, environment templates — through the Postman Package Library for cross-team reuse. Reports aggregate across team workspaces for portfolio-level visibility. Common in product organizations that want quality to scale with the team. The shared library is the connecting tissue; each team owns its own quality with the same standards applied everywhere.
Pattern 3 — Self-Service Platform (Platform model)
A workspace template auto-provisioned for every new service, pre-loaded with standard packages, governance rules, monitor templates, and CI integrations. The platform team's job is to make the right thing the easy thing; the product team's job is to use the template, customize it, and own quality end-to-end. Postman APIs and CLI are the integration points for internal developer platforms — Backstage, Cortex, Port. Common in cloud-native, platform-engineering-mature organizations. The template is the contract; the platform team and the product team both win when adoption is high.
Migration as wedge across all three. Replacing an incumbent framework — ReadyAPI, SoapUI, Karate, custom harnesses — applies regardless of operating model. AI-powered migration translates legacy projects to native Postman collections, preserving assertions, variable chaining, data-driven loops, and scripts. Once migrated, the team is already on the platform; expansion into the rest of the journey — gates, monitors, evidence, AI — follows naturally.
Differentiation
QE programs don't typically evaluate seven vendors. They face three actual alternatives.
vs. Do nothing — the status quo
The biggest competitor isn't another vendor. It's the existing program: framework-per-protocol, gates-per-stage, evidence assembled by hand at quarter-end. For functions already meeting current SLAs, staying the course is the rational default — change carries real cost, and incremental improvements seem like they should keep the program on track.
The status quo is why quality runs serially behind development. It's why testing tooling fragments — every protocol gets a different vendor and the seams between them never close. It's why tests rot — no single layer owns test maintenance. It's why audit evidence is a scramble. It's why coverage concentrates in flagship services. And it's why AI amplifies every gap — the program was sized for a world where these forces were future tense.
I want the software QA to be more focused on figuring out what the test cases should be — not on implementing them and not on managing them. We spend a lot of time fixing broken tests that are not from the development side. We renamed a style and all the tests break.
The status quo isn't free. It costs release velocity, escaped defects, and engineering capacity that isn't building product.
vs. Build it ourselves
The second most common alternative. The organization wires together open-source tooling — REST Assured for functional, Karate for end-to-end, k6 for performance, Pact for contract, Newman for CI execution, Spectral for governance — adds custom dashboards, integrates with internal CI/CD, and gets a QE platform shaped exactly to the organization with no vendor lock-in.
This works until it doesn't. The core problem isn't whether it can be built — most large engineering organizations can build it. It's that it can't be maintained. Open-source tools have independent lifecycles; keeping seven of them in sync — version bumps, security patches, deprecations, integration testing across the stack — is a permanent engineering tax that grows with the surface area. Most internal builds underestimate this by an order of magnitude at planning time.
DIY also can't keep up with the AI capability surface. The platform you started building 18 months ago doesn't include AI test generation, AI failure triage, or AI test repair — and adding those means staffing a perpetual modernization team building against rapidly evolving foundation models. Postman AI capabilities ship as part of the platform; the QE function inherits the next generation rather than building it.
Our QA team has built some thing — written in Java that makes API calls. With a lot of people that just don't know Java, I see these tests and these suites being almost abandoned. Historically these test suites are always janky, always cobbled together. They get outdated. No one's got the time or the patience to figure out how to fix it. So the test gets commented out and it dwindles from there.
vs. Point solutions
The third alternative is stitching together specialized tools, each solving one stage or one test type.
Contract testing (Pact) covers consumer-driven contract verification between services. Strong at its category, but the artifact isn't portable — the contract test doesn't extend into pre-release end-to-end suites, doesn't run as a synthetic monitor, and doesn't share a workspace with the integration tests downstream.
Performance testing (k6, k6 Cloud, BlazeMeter, JMeter) simulates load under various profiles. Specialized depth in cloud-hosted form that Postman's performance testing doesn't yet match. But the test definition lives in a separate format from the functional tests authored upstream — double-authoring per service, no shared evidence trail, per-vendor governance scaling linearly.
Synthetic monitoring (Datadog Synthetic, Checkly, Pingdom) runs production checks. Most only hit public endpoints; internal-API synthetic monitoring requires separate tooling or open-source rigging. The monitor's failure data lives in the monitoring tool's dashboard, separate from the test history that produced the artifact.
End-to-end testing (ReadyAPI, Katalon, Tricentis Tosca) covers complex workflow scenarios. Strong at GUI-driven authoring, but tests don't run in CI/CD without per-tool licensing and configuration, and don't share artifacts with the contract tests upstream or the synthetic monitors downstream.
Governance and dashboards (custom Spectral configurations on top of N tools) sit over everything else, trying to assemble a unified picture from disparate vendor outputs. Per-tool governance scales with the number of tools. Per-tool reporting requires custom collation. Audit evidence requires multi-vendor extraction.
We use Sauce Labs. We have a Selenium-based custom framework. We've worked with ReadyAPI, Postman, then we use qtest, and we're starting to evaluate some more AI-based tools. One of our big problems is the adoption of automation and teams just having the expertise to create the Selenium scripts.
The fundamental limitation: each tool solves one stage or one test type, and the seams between them are where coverage actually leaks. No contract tool knows about your integration test artifacts. No performance tool knows about your monitoring history. No synthetic tool knows about your CI gate definitions. Per-vendor AI capabilities don't share context. Audit evidence requires multi-vendor collation. Procurement, security review, and renewal cycles multiply by vendor count.
Postman is the through-line — the workspace where artifacts accumulate across the entire QE journey, where the contract test that runs as a PR gate is the same artifact that runs as a regression check, as part of a pre-release suite, and as a synthetic monitor in production.
What comes next
The programs that reach hundreds of services without breaking didn't start with a transformation initiative. They started by replacing one muted test suite with one workspace and watching what happened next.
We've helped organizations across every industry in this guide make that shift. If you'd like to talk through where your program is today and where the biggest leverage points are, our team is here: postman.com/enterprise